OPEN ACCESS
Anaerobic digestion is an established technology to treat different kinds of wastes and to simultaneously produce biogas, a mixture of methane and carbon dioxide, which is a useful and renewable energy source. In this work, the anaerobic digestion of buffalo manure is studied. The latter is a low cost substrate rich in carbohydrates, especially suitable to produce biogas in anaerobic digesters. The process is performed both under mesophilic (37 °C) and thermophilic (55 °C) conditions with pH spanning from 6.0 to 8.7. Many different samples, deriving both from lactating and non-lactating buffaloes, are used. Under mesophilic conditions, our results are essentially in line with literature, and the highest methane concentration in the biogas (even above 65 %) is obtained with pH = 7.0. Conversely, under thermophilic conditions, we observed that also with pH > 8.0, the anaerobic process runs efficiently. In particular, methane concentration in the biogas reaches values around 70 %, with production rates almost twice those obtained at 37 °C. This experimental observation is particularly interesting for those wastes showing a natural basic pH, as the buffalo manure at hand; in these cases, in fact, the digestion process can start without any manipulation of the pH.
Anaerobic digestion, Bio-methane, Buffalo manure.
Anaerobic digestion is widely used in the treatment of different organic wastes for production of biogas with whole range of benefits for their users that include: production of heat and electricity, transformation of organic waste into high-quality fertilizer, improvement of hygienic conditions through reduction of pathogens, reduction of work for firewood collection and cooking, and environmental advantages through protection of soil, water, air, and woody vegetation [1].
Anaerobic treatment comprises decomposition of organic material in the absence of free oxygen and production of methane, carbon dioxide, ammonia and traces of other gases and organic acids of low molecular weight [2]. It is a complex process, which can be divided into four main phases: hydrolysis, acidogenesis, acetogenesis and methanogenesis. The degradation steps are carried out by different consortia of microorganisms [3], which partly stand in syntrophic interrelation and place different requirements on the environment [4]. The microorganisms producing methane are called methanogens and are usually archaea bacteria [5]. Microorganisms are classified according to their optimal pH range [6] and to maximize the CH4 yield, pH typically varies from 6.5 to 8.2, with optimal values of 7.0 - 7.2 [7]. Apart from the pH, the production of methane from anaerobic digestion of livestock manures principally depends on the matter added to the digester, the solids loading, the hydraulic retention time and the temperature [8, 9]. Tewelde et al. [10] used a process temperature equal to 35 (±5) °C and a pH 7.5 in batch mode, obtaining a bio-methane concentration equal to 69 % by digestion of brewery wastes; Kalia [11] used 23 °C and pH 8.2 in batch mode, obtaining a bio-methane concentration equal to 60 % by digesting cattle dung, while Abubakar and Nasir [12] used a temperature equal to 53 °C and a pH equal to 7.0 obtaining methane concentration equal to 47 % for cow dung in a semi-continuous process.
In this study, the effect of temperature and pH on the bio-methane production from digestion of water buffalo manure is investigated. This is quite new since in the literature attention has not been paid to this kind of dung, moreover we will also treat separately manure coming from lactating and non-lactating buffaloes. The latters are fed differently from the formers also because of their different hormonal phase. This will allow highlighting whether these differences affect the digestion process. The amount of methane produced under different experimental conditions is compared to identify the optimal process parameters. The anaerobic digestion of water buffalo manure is performed at mesophilic (37 °C) and thermophilic (55 °C) conditions, with pH varying from acid (pH = 6.0) to basic (pH = 8.7) values.
2.1 Material
Manures from both lactating (LB) and non-lactating (N-LB) buffaloes are collected during a period of time covering more than three years, from the farm “La Valentina s.r.l.”, located in the municipality of Villa Literno, in Campania (South Italy). The manure samples are taken in the morning; they are placed in sterile plastic containers, transported to the laboratory and immediately stored in the fridge at +4 °C [13]. In this way, the bacteria metabolism slows down and the properties of the manure remain stable until the effective start of the digestion process.
The fresh manure samples studied in this work are characterized in terms total solids (TS) and volatile solids (VS) content, measured according to European Standard Methods [14, 15]. TS varied from about 17 to 35 % (Table 1) and the mean value is 26.8 % ± 6.3 %. This large standard deviation is probably due to differences of the animal food supply, the season of the year and the hormonal phase of the cattles [16]. VS varies from about 52 to 74 % and these values are similar to those observed in literature for manure and sewage sludge [17]. VS content indicates the organic matter content of the biomass and it is often used for the estimation of the effectively decomposable material fraction.
The pH of the manures, pHsub, is also measured upon collection and resulted always basic; in particular, it varied from 7.1 to 8.8.
Table 1. Properties of buffalo manure samples
|
n° |
Typology |
TS [%] |
VS [%] |
pHsub |
|
1 |
LB |
28.6 |
|
8.8 |
|
2 |
N-LB |
29.8 |
- |
8.7 |
|
3 |
LB |
20.6 |
- |
8.8 |
|
4 |
LB |
26.9 |
- |
7.6 |
|
5 |
LB |
17.1 |
- |
7.3 |
|
6 |
LB |
20.7 |
73.9 |
7.6 |
|
7 |
NL-B |
35.3 |
67.3 |
7.9 |
|
8 |
N-LB |
22.4 |
52.5 |
7.1 |
|
9 |
LB |
33.1 |
72.9 |
7.3 |
|
10 |
N-LB |
33.8 |
73.9 |
7.7 |
2.2 Digester and operating conditions
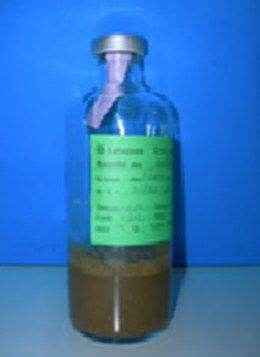
Figure 1 shows the borosilicate glass bottle used as batch digester in this study. Each bottle has a total volume of about 280 ml; the effective working volume is maintained at 80 ml and 200 ml was left for the gas. Three replicates of each sample are prepared for statistical needs.
The manure is mixed with distilled water to achieve a manure/water mass ratio equal to 30/70. Preliminary tests showed that higher mass ratio increases the production of methane, at the cost of more viscous slurries, thus complicating their pumping. It is known, in fact, that a slurry viscosity increases by increasing the solid content [18, 19, 20, 21]. The pH of the samples is either corrected to reach two different values (6.0 and 7.0) by adding opportune amount of 1 M HCl water solution, or it is not modified. Manure/water slurries are opportunely mixed following a three steps procedure: they are firstly hand mixed, then electrically homogenized for 2 min and finally filtered with a Büchner filter equipped with a vacuum pump. Guarino et al. [22] showed that these mechanical three steps pre-treatments, compulsories in a continuous process in lab-scale reactors, do not alter the digestion process. The manure/water mixture is poured in the bottle and the anaerobiosis is obtained blowing nitrogen inside the closed reactors with a two-needles system. The bottles are manually shaken once a day to limit the sample sedimentation. The measurement of the produced gas composition is performed with the MicroGC Agilent 3000 equipped with two capillary columns: a MolSieve 5 A and a Poraplot U.
Figure 1. Batch digester
2.3 Data analysis
Results of each experimental campaign are here showed in terms methane volume fraction as a function of the digestion time. Data are interpolated using the modified Gompertz equation Eq(1) [23]:
$H=P \exp \left\{-\exp \left[\frac{R_{m} \cdot e}{P}(\lambda-\mathrm{t})+1\right]\right\}$(1)
where H [%] is the cumulative production, P [%] is the productivity, i.e. the volume fraction asymptotic value,
Rm [h-1] is the maximum production rate, λ [h] the lag-phase time, e is Euler’s number and t [h] the digestion time.
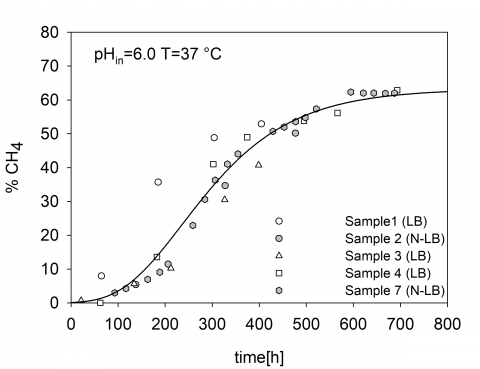
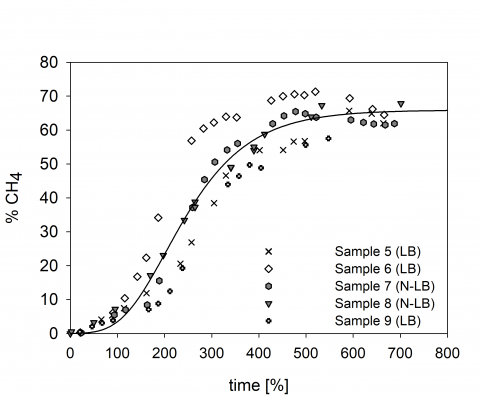
Figure 2 and Figure 3 show CH4 volume fraction as a function of time for digestion processes run with initial pH equal to 6.0 and 7.0, respectively, and temperature equal to 37 °C. In particular, Figure 2 shows the case study A where the samples 1, 2, 3, 4 and 7 of Table 1 are processed starting from an initial pH = 6.0 and Figure 3 shows the case study B where samples 5, 6, 7, 8 and 9 of Table 1 are digested starting from an initial pH = 7.0. In both cases, all data in the plot are interpolated with a single regression curve (Eq.1). The corresponding values of Gompertz parameters P, Rm and λ, obtained from the best fit of experimental data, are listed in Table 2 together with the regression coefficient R2 and the value of the pHfin, measured at the end of the digestion process.
The case study A of Figure 2 (pH = 6.0, T = 37 °C) shows a regular sigmoidal trend with a methane productivity P ~ 63 %, a lag-phase time of 108 h and a production rate Rm = 0.18 h-1. These samples typically have a final pHfin of about 6.9 ± 0.2 and this indicates that during the digestion of buffalo manures the system (auto)-evolved towards a neutral pH.
Case study B data in Figure 3 (pH = 7.0, T = 37 °C) and Table 2 show some small differences with respect to the samples digested starting from an initial pHin = 6.0: the value of P is slightly higher and it is equal to 66 %, and the production rate is faster and equal to 0.25 h-1; the lag-phase time is unchanged and results 108 h. It is interesting to remark that also in this case pHfin is neutral and this suggests that it remains almost constant during the entire digestion process.
Figure 2. Case study A: Evolution of CH4 concentration with time at pHin = 6.0 and T = 37 °C. Symbols are the experimental data, line is the global fit curve
Figure 3. Case study B: Evolution of bio-methane concentration with time at pHin = 7.0 and temperature 37 °C. Symbols are the experimental data, line is the global fit curve
Figure 4. Evolution of bio-methane concentration with different process conditions. Symbols are the experimental data, lines are the regression curves
Table 2. Gompertz parameters
|
Case study |
pHin |
T[°C] |
P[%] |
λ[h] |
Rm[h-1] |
R2 |
pHfin |
|
A |
6.0 |
37 |
63.2 |
108 |
0.18 |
0.94 |
6.9 |
|
B |
7.0 |
37 |
65.9 |
108 |
0.25 |
0.93 |
7.0 |
|
C |
7.5 |
37 |
65.2 |
88.6 |
0.21 |
0.99 |
7.0 |
|
D |
8.1-8.7 |
55 |
71.6 |
68.5 |
0.43 |
0.98 |
7.7 |
The measured high productivity may be due to the higher initial pH that may promote the hydrogenotrophic methanogenesis during which the CO2 and H2 are converted into CH4 and H20 [25]. Also the pH decrease in time suggests that the acidogenic phase is well operated during which fatty acids are released, due to the degradation of cellulosic material of the manure, and they balance the system pH.
The results obtained at 55 °C and pHin = 8.1 and 8.7 (sample 9 and 10) sounds very promising, but the generalization of this experimental observations requires further studies with also other manure samples. In fact, samples 9 and 10 are peculiar substrate, probably particularly rich in methanogenic bacteria. In fact, these samples were able to produce methane also after a thermal pretreatment at 90 °C for 6 h, specifically carried out to suppress all methanogenic bacteria [26, 27] and by using a pHin = 5.5, typically unfavorable to bio-methane production.
In this work, we compared the bio-methane produced by digesting water buffalo manure, in batch mode, under different process conditions. In particular, we modified two of the most important parameters affecting the process [28]: the pH and the temperature. The pH is not controlled during the digestion process, but only at its beginning and it is set at five different values varying from 6.0 to 8.7. Since the natural pH of the manure is slightly basic (Table 1), to obtain the value of pH = 6.0 and 7.0, we acidified the system with 1 M HCl water solution, while values of pHin = 7.5, 8.1 and 8.7 were obtained without any pH correction. The pH is always measured at the end of digestion process. The temperature was set to 37 and 55 °C.
We observed that all the samples digested at 37 °C tend to a final neutral pH value, both when the initial one was acid or basic. A starting basic pH favored the production of bio-methane, since it reduced the lag-time while increasing the production rate (Table 2). This observation suggested that the digestion process of naturally basic substrate, as the manure at hand, can start without any manipulation of the substrate pH. Experimental results also showed that at 55 °C the production of bio-methane is favored with respect to that obtained at 37 °C and in this case though the system tends to auto-evolve towards neutrality, as for the cases at 37 °C. This may indicate that the methanogenic bacteria community has an optimal operative pH interval at 55 °C different from that at 37 °C, or that the bacteria community that prevails at 55 °C is different from that prevailing at 37 °C. To elucidate this point further investigations are deserved, however, the use of high temperatures represents a cost of the process and its effective convenience must also be carefully evaluated.
|
LB |
lactating buffalo manure. |
|
NL-B |
no lactating buffalo manure. |
|
TS VS |
total solids. % volatile solids. % |
|
pHsub |
original substrate pH. |
|
pHfin |
pH at the end of the digestion process. |
|
H |
cumulative production. % |
|
P |
Productivity. % |
|
Rm |
maximum production rate. h-1 |
|
λ |
lag-phase time. h |
|
e |
Euler’s number. |
|
t |
digestion time. h |
[1] Tafdrup, S., “Viable energy production and waste recycling from anaerobic digestion of manure and other biomass materials,” Biomass and Bioenergy, vol. 9, no. 1, pp. 303-314, 1995. DOI: 10.1016/0961-9534(95)00098-4.
[2] Lopes, W. S., Leite, V. D. and Prasad, S., “Influence of inoculum on performance of anaerobic reactors for treating municipal solid waste,” Bioresource Technology, vol. 94, no. 3, 261-266, 2004. DOI: 10.1016/j.biortech.2004.01.006.
[3] Carillo, P., Carotenuto, C., Di Cristofaro, F., Kafantaris, I., Lubritto, C., Minale, M., Morrone, B., Papa, S. and Woodrow, P., “DGGE analysis of buffalo manure eubacteria for hydrogen production: Effect of pH, temperature and pretreatments,” Molecular Biology Reports, vol. 39, no. 12, pp. 10193-10200, 2012. DOI: 10.1007/s11033-012-1894-3.
[4] Angelidaki, I., Ellegaard, L. and Ahring, B. K., “A mathematical model for dynamic simulation of anaerobic digestion of complex substrates: Focusing on ammonia inhibition,” Biotechnology and Bioengineering, vol. 42, no. 2, pp. 159-166, 1993. DOI: 10.1002/bit.260420203.
[5] Watanabe, T., Asakawa, S., Nakamura, A., Nagaoka, K. and Kimura, M., “DGGE method for analyzing 16S rDNA of methanogenic archaeal community in paddy field soil,” FEMS Microbiology Letters, vol. 232, no. 2, pp. 153-163, 2004. DOI: 10.1016/S0378-1097(04)00045-X 153-163.
[6] Sibiya, N. T., Muzenda, E. and Tesfagiorgis, H. B., “Effect of temperature and pH on the anaerobic digestion of grass silage,” 2004. Available: http://hdl.handle.net/10210/13590.
[7] Rao, M. S. and Singh, S. P., “Bioenergy conversion studies of organic fraction of MSW: kinetic studies and gas yield–organic loading relationships for process optimization,” Bioresource Technology, vol. 95, no. 2, pp. 173-185, 2004. DOI: 10.1016/j.biortech.2004.02.013.
[8] Nozhevnikova, A. N., Kotsyurbenko, O. R. and Parshina, S. N., “Anaerobic manure treatment under extreme temperature conditions,” Water Science and Technology, vol. 40, no. 1, pp. 215-221, 1999. DOI: 10.1016/S0273-1223(99)00387-X.
[9] Hashimoto, A. G., “Methane from cattle waste: effects of temperature, hydraulic retention time, and influent substrate concentration on kinetic parameter (K),” Biotechnology and Bioengineering, vol. 24, no. 9, pp. 2039-2052, 1982. DOI: 10.1002/bit.260240911.
[10] Tewelde, S., Eyalarasan, K., Radhamani, R. and Karthikeyan, K., “Biogas production from co-digestion of brewery wastes [BW] and cattle dung [CD],” Int. J. Latest Trends Agric. Food Sci., vol. 2, pp. 90-93.
[11] Kalia, A. K. and Singh, S. P., “Effect of mixing digested slurry on the rate of biogas production from dairy manure in batch fermenter,” Energy Sources, vol. 23, no. 8, pp. 711-715, 2001. DOI: 10.1080/009083101316862462.
[12] Abubakar, B.S.U.I. and Nasir, I., “Anaerobic Digestion of cow dung for biogas production,” ARPN Journal of Engineering and Applied Sciences, vol. 7, no. 2, pp. 169–172, 2012.
[13] Giovanna Guarino, Claudia Carotenuto, Filomena di Cristofaro, Stefania Papa, Biagio Morrone and Minale, M., “Does the C/N ratio really affect the Bio-methane Yield? A three years investigation of Buffalo Manure Digestion,” Chemical Engineering Transactions, vol. 49, 2016. DOI: 10.3303/CET1649078.
[14] Unificazione, E.N.I.D., “Characterization of waste - Calculation of dry matter by determination of dry residue or water content,” pp. 24, 2007.
[15] Unificazione, E.N.I.D., “Characterization of waste. Determination of loss on ignition in waste, sludge and sediments,” pp. 16, 2007.
[16] Carillo, P., Carotenuto, C., Di Cristofaro, F., Lubritto, C., Minale, M., Mirto, A., Morrone, B., Papa, S. and Woodrow, P., “Bacterial and archaeal communities influence on methane production,” Chemical Engineering. Transactions, vol. 37, pp. 859-864, 2004. DOI: 10.3303/CET1437144.
[17] Gilroyed, B. H., Chang, C., Chu, A. and Hao, X., “Effect of temperature on anaerobic fermentative hydrogen gas production from feedlot cattle manure using mixed microflora,” International Journal of Hydrogen Energy, vol. 33, no. 16, pp. 4301-4308, 2008. DOI: doi:10.1016/j.ijhydene.2008.06.016.
[18] D’Addio, L., Carotenuto, C., Di Natale, F. and Nigro, R., “A new arrangement of blades in scraped surface heat exchangers for food pastes,” Journal of Food Engineering, vol. 108, no. 1, pp. 143-149, 2012. DOI: 10.1016/j.jfoodeng.2011.07.014.
[19] Carotenuto, C. and Minale, M., “On the use of rough geometries in rheometry,” Journal of Non-Newtonian Fluid Mechanics, vol. 198, no., pp. 39-47, 2013. DOI: 10.1016/j.jnnfm.2013.04.004.
[20] Carotenuto, C., Merola, M.C., Álvarez-Romero, M., Coppola, E. and Minale, M., “Rheology of natural slurries involved in a rapid mudflow with different soil organic carbon content,” Colloids and Surfaces A: Physicochemical and Engineering Aspects, vol. 466, pp. 57-65, 2015. DOI: 10.1016/j.colsurfa.2014.10.037 10.
[21] Hedge, R. N., Rao, S. S., and Reddy, R. P., “Role of surface roughness in pool boiling with Alumina-water nanofluid on a horizontal wire surface,” International Journal of Heat and Technology, vol. 29, no. 1, pp. 165-171, 2011.
[22] Guarino, G., di Cristofaro, F., Carotenuto, C., Morrone, B. and Minale, M., “Effect of thermal and mechanical pre-treatments on the CH4-H2 Production from water buffalo manure in different process conditions,” Chemical Engineering, vol. 38, pp. 205-510, 2014. DOI: 0.3303/CET1438035.
[23] Khanal, S. K., Chen, W. H., Li, L. and Sung, S., “Biological hydrogen production: effects of pH and intermediate products,” International Journal of Hydrogen Energy, vol. 29, no. 11, pp. 1123-1131, 2004. DOI: 10.1016/j.ijhydene.2003.11.002.
[24] Aoki, K., Umetsu, K., Nishizaki, K., Takahashi, J., Kishimoto, T., Tani, M., Hamamoto, O. and Misaki, T., “Thermophilic biogas plant for dairy manure treatment as combined power and heat system in cold regions,” International Congress Series, vol. 1293, no. 03, pp. 238-241, 2006. DOI: 10.1016/j.ics.2006.03.014.
[25] Schink, B., “Energetics of syntrophic cooperation in methanogenic degradation,” Microbiology and Molecular Biology Reviews, vol. 61, no. 2, pp. 262-280, 1997.
[26] Di Cristofaro, F., Carotenuto, C., Carillo, P., Woodrow, P., Morrone, B., and Minale, M., “Evaluation of CH4 and H2 yield with different mixtures of digested and fresh buffalo manure,” Chemical Engineering Transactions, vol. 37, pp. 283-288, 2014. DOI: 10.3303/CET1437048.
[27] Francioso, O., Montecchio, D., Salomoni, C., Caputo, A. and Palenzona, D., “Convenient renewable energy from bacterial metabolism of organic wastes,” International Journal of Heat and Technology, vol. 27, no. 1, pp. 151-155, 2009.
[28] Yokoyama, H., Waki, M., Moriya, N., Yasuda, T., Tanaka, Y. and Haga, K., “Effect of fermentation temperature on hydrogen production from cow waste slurry by using anaerobic microflora within the slurry,” Applied Microbiology and Biotechnology, vol. 74, no. 2, pp. 474-483, 2007. DOI: 10.1007/s00253-006-0647-4.