OPEN ACCESS
Public energy policies must support the deep energy retrofit of buildings in order to fight climate change and energy poverty. Assessing the impact of such policies is extremely important because the supported energy retrofit measures (ERMs) can ensure huge energy, economic and environmental benefits. However, the energy investigation of wide building stocks is very complex. This issue is here tackled by using and enhancing the methodology SLABE (‘Simulation-based Large-scale uncertainty/sensitivity Analysis of Building Energy performance’), which conducts reliable analyses of energy retrofitting building categories. SLABE employs Latin hypercube sampling to generate Representative Building Samples (RBSs), which represent the energy behaviour of the explored building stock. Then, post-processing is applied to assess the impact of proper ERMs on energy consumption, polluting emissions and lifecycle costs. Thus, the cost-optimal retrofit solutions are found in absence and presence of financial incentives, respectively. The outcomes are exploited to assess the effectiveness of current energy policies and to propose potential improvements for harmonizing the public and private perspectives. The methodology combines EnergyPlus and MATLAB®. As case study, it is applied to the Italian office building stock. The outcomes show huge potential energy and cost savings as well as polluting emission reductions.
Dynamic energy simulations, Building energy retrofit, Building stock, Representative building sample, Energy policies.
It is well known that the deep energy renovation of the building stock is fundamental to fight some of the most urgent problems of our generation, such as climate change and energy poverty [1]. However, it is a very arduous issue that involves two different perspectives, normally divergent: the public and the private ones [2]. The public perspective represents the interests of the collectivity (i.e., the state), which aims at minimizing energy consumption and polluting emissions. The private perspective represents the interests of building owners and/or tenants, who aim at minimizing the economic expenditure. At EU (European Union) level, in order to harmonize the two perspective, the Energy Performance of Buildings Directive (EPBD) recast (2010/31/EU) [3] and the Delegated Regulation (EU) No. 244/2012 [4] recommend the cost-optimal analysis to address building energy retrofit. This kind of analysis aims at minimizing global (i.e., lifecycle) costs (hereinafter denoted with GC) due to energy uses, considering both investment and operation costs. The cost-optimal energy retrofit is given by the package of energy retrofit measures (ERMs) that minimizes GC. This ensures a good trade-off between the public and private perspectives [5]. Nevertheless, the cost-optimal analysis cannot be applied to each building of a wide stock because it is quite computationally expensive. Indeed, several building retrofit scenarios should be investigated by means of reliable but time-consuming BPS (building performance simulation) tools [6]. Therefore, the European regulations [3, 4] recommend to apply the cost-optimal analysis only to representative buildings, the so-called reference buildings. These should represent all building categories in which the national building stocks can be subdivided. The cost-optimal retrofit solutions that are identified for the reference buildings are, then, considered valid for the members (buildings) of the represented categories [5, 7]. Definitely, this approach implies acceptable computational times and efforts because only a few buildings, i.e., the reference buildings, are investigated via the cost-optimal methodology. Nevertheless, the achieved outcomes are not robust for all categories’ members because a reference building is able to represent reliably only a very restricted part of a category, as shown in [2]. In this regard, the reference building approach can be replaced by the representative building sample (RBS) approach, proposed by the same authors in [2]. This latter employs a group of buildings (i.e., the RBS), instead of a single building, to represent a building category, thereby capturing the main heterogeneous energy characteristics of the category’s members. Thus, it ensures more reliable and representative results, which can be dependably extended to a wide segment of the category.
All told, the cost-optimal analysis is a powerful tool that yields the minimization of building lifecycle costs, thereby favouring the private perspective. Furthermore, it is advantageous also for the public perspective, since it normally implies significant energy savings and polluting emissions’ reductions [8, 9]. However, effective and well-thought-out energy policies [10] that provide financial incentives to ERMs are necessary in order to properly direct the cost-optimal solutions towards the reduction of buildings’ environmental impact. In this regard, several energy polices were enacted to support building energy retrofit at national and international levels. For instance, current Italian laws provide public financial incentives for ERMs addressed to both building thermal envelope and energy systems [11]. Definitely, assessing the impact of such policies on the energy performance of wide building stocks is highly worthwhile, because the implementation of the supported ERMs can ensure huge energy, economic and environmental benefits at large scale. The arduous issue is that when a whole building stock is explored, instead of single buildings, the assessment of energy performance and retrofit scenarios is much more complex.
In the proposed study, this issue is tackled by using the aforementioned RBS approach, which is implemented within the methodology SLABE that was presented by the same authors in [2]. This performs a reliable analysis of energy retrofit scenarios for building categories. SLABE is here updated to address the energy retrofit of a wide building stock, including different categories, by identifying the cost-optimal solutions. The outcomes are exploited to evaluate the effectiveness of energy policies and to propose potentials improvements in order to harmonize the two mentioned perspectives. EnergyPlus [12] is used as BPS tool, and combined with MATLAB® [13] for data analysis and processing. For demonstration purposes, the methodology is applied to the Italian office building stock.
The proposed methodology provides the thorough investigation of energy retrofitting a wide building stock in order to achieve the following main goals:
The methodology derives from the procedure SLABE, (‘Simulation-based Large-scale uncertainty/sensitivity Analysis of Building Energy performance’), proposed by some of the same authors in [2] in order to detect cost-optimal retrofit solutions for an established category, which means a cluster of buildings with the same use destination, construction type and climatic location. SLABE is here updated in order to address the energy retrofit of a wide building stock, composed of different categories, as well as to investigate the effectiveness and potential improvements of current energy policies. In the following subsections, the original version of SLABE is first briefly described, and then the enhancements carried out in this study are detailed.
2.1 SLABE: Assessment of energy performance and retrofit scenarios for building categories
SLABE allows to assess cost-optimal energy retrofit strategies for a building category by conducting large-scale uncertainty (UA) and sensitivity analyses (SA). The category is characterized by defining n characteristic parameters (pi), related to geometry, building envelope and HVAC systems, which affect primary energy consumption for space conditioning (PEC). For each parameter, a range of variability and a type of probabilistic distribution are identified by means of UA, thereby defining the sample space to be investigated. Thus, Latin hypercube sampling (LHS) is performed to generate a representative building sample (RBS), which consists in a set of theoretical buildings that represent the energy behavior of the entire category. The RBS size (N), given by the number of sampled cases (buildings included in the set), must be carefully chosen in order to achieve representative results in a reasonable computational time. As shown in [2], the minimum RBS size that implies reliable results is around 2.2 times the number of sampled parameters (n). The energy performance of all RBS’s members are simulated in EnergyPlus, and MATLAB® is employed to manage the simulations as well as for data post-processing. The developed automatic coupling between these programs allows to asses the values of PEC and GC (global cost for space conditioning) for each sampled case.
The energy assessment of the existing building category (as is) is followed by the investigation of energy retrofit scenarios. Proper and effective ERMs are found by means of SA. Then, the combinations (packages) of these measures are explored. In particular, the ERMs introduce e characteristic parameters (mi) that are associated to their implementation. Exhaustive sampling is performed in order predict the energy performance of each RBS’s member in presence of each explored retrofit package. Notably, the described coupling between EnergyPlus and MATLAB® is employed to predict the values of PEC and GC for each sampled case. The outcomes identify the cost-optimal retrofit solution, given by the package of ERMs that produces significant GC savings for the highest number of buildings.
It is noticed that SLABE is thoroughly described in [2] to which the reader is referred for complete details.
2.2 Enhancement of SLABE for the application to a whole building stock
As illustrated, SLABE addresses the cost-optimal analysis of energy retrofitting an established category. The methodology is here updated and enhanced in order to:
In particular, the updated procedure presents two main stages that are elucidated in the following subsections:
2.2.1 Stage 1: Assessing current building energy performance
An established wide building stock is investigated. First of all, this stock is subdivided into a number, denoted with c, of building categories. These are defined through SLABE by identifying and characterizing c groups of n characteristic parameters (pi), related to geometry, building envelope and HVAC systems. Hence, for each category a RBS is generated by employing LHS as described in subsection 2.1. For each sampled case (i.e., building) the values of PEC, GC and EM are assessed by means of the coupling between EnergyPlus and MATLAB®. In particular, EnergyPlus dynamic simulations provide the hourly values of thermal energy demand for space heating (TEDh) and cooling (TEDc), respectively, over the year. Then, a post-process code, written in MATLAB®, allows to calculate PEC, GC and EM by converting the hourly values of TEDh and TECc through the performance curves of the HVAC systems and proper primary energy conversion factors. GC is assessed according to the guidelines of the EPBD recast [3, 4], by setting the real interest rate equal to 3% and the energy price escalation rate equal to 2%. In addition, as recommended in [3, 4], the adopted calculation period is 20 years for residential buildings and 30 years for non-residential ones, such as the office buildings of the examined case study. EM is assessed from the values of energy consumption by using proper emission factors.
Therefore, c set of values of PEC, GC, and EM are achieved, one for each RBS (corresponding to a certain building category), which provide a comprehensive picture of the current energy performance of the building stock.
2.2.2 Stage 2: Assessing cost-optimal retrofit solutions and the effectiveness and potential improvements of energy policies
Proper ERMs are investigated for the energy retrofit of the building stock. These are chosen in function of building energy characteristics and best-practice. Furthermore, they include the main ERMs that are financially supported by current energy policies. The ERMs are characterized by introducing e parameters mi, which are associated to their implementation.
Thus, an exhaustive sampling is performed in order to predict the energy performance of the buildings included in the c RBSs, in presence of each combinations of the considered ERMs. The coupling of EnergyPlus and MATLAB® provides the values of PEC, GC and EM for each sampled case. The results implies an immediate detection of the cost-optimal energy retrofit solution for each RBS, and thus for each building category. The cost-optimality is given by the package of ERMs that produces GC savings for the highest number of the RBS’s members (i.e., building sampled cases). The described procedure is carried out twice in order to examine the following two different scenarios:
The comparison between the values of GC achieved in these two scenarios allows to assess the impact and effectiveness of energy policies in supporting the deep energy renovation of the existing building stock. Finally, based on the achieved results, guidelines are proposed in order to provide more effective policies, as thoroughly showed in the following case study (see section 4 that reports the achieved results).
The Italian office building stock is investigated by applying the proposed methodology. In this regard, the ENEA (Italian national agency for new technologies, energy and sustainable economic development) examined this stock by conducting a comprehensive statistical analysis of geometry, building envelope and HVAC systems [14]. Such analysis is here exploited to set the energy characteristics of existing buildings. The explored stock includes about 64’900 units.
3.1 Current state of the building stock
The building stock covers six Italian climatic zones, namely A, B, C, D, E and F, which differ for the value of heating degree days, HDDs (see Table 1). The climatic zone A is not considered because it includes only two municipalities, and thus it does not provide representative outcomes. Therefore, the building stock is subdivided into five categories, which correspond to the climatic zones B, C, D, E and F, respectively. For each category, a typical weather data file [15] is chosen to be used in EnergyPlus simulations, as reported in Table 1.
Table 1. Characterization of the Italian main climatic zones
|
Heating Degree Days (HDDs) |
Typical Weather Data File [15] |
|
Zone B: HDDs ∈ [601, 900] |
Palermo → HDDs = 751~ 650’000 inhabitants |
|
Zone C: HDDs ∈ [901, 1400] |
Napoli→ HDDs = 1034~ 980’000 inhabitants |
|
Zone D: HDDs ∈ [1401, 2100] |
Firenze → HDDs = 1821~ 370’000 inhabitants |
|
Zone E: HDDs ∈ [2101, 3000] |
Milano → HDDs = 2404~ 1’300’000 inhabitants |
|
Zone F: HDDs ∈ [3001, +∞] |
Bolzano* → HDDs = 2791~ 100’000 inhabitants |
It is noticed that considering different climatic zones is fundamental because weather conditions highly affect building energy performance, as shown by Genco et al. [16]. Buildings are assumed to have a rectangular geometry and a structural frame in reinforced concrete, with vertical walls in hollow bricks. The roofs and floors are in mix brick-reinforced concrete, whereas the internal partitions are composed of 15 cm thick concrete [2]. These hypotheses allow to cover a broad segment of the investigated stock. Each of the five categories is characterized by means of the n = 21 parameters of Table 2.
Each parameter is defined by assigning a range of variability within the category and a type of probabilistic distribution. Such values are set according to the mentioned ENEA statistical study [14] and to the authors’ experience, as reported in Table 3, for representing a significant amount of Italian office buildings.
Table 2. Characteristic building parameters (pi)
|
Parameters related to the Geometry |
|
|
p1) |
Orientation (angle between North axis and building North) |
|
p2) |
Area of each floor [m2] |
|
p3) |
Form ratio |
|
p4) |
Floor height [m] |
|
p5) |
Window to wall ratio: South |
|
p6) |
Window to wall ratio: East |
|
p7) |
Window to wall ratio: North |
|
p8) |
Window to wall ratio: West |
|
p9) |
Number of floors |
|
Parameters related to the Building Envelope |
|
|
p10) |
Thickness of external vertical walls, tv [m] |
|
p11) |
Thermal transmittance of external vertical walls, Uv [W/m2 K] |
|
p12) |
Solar absorptance of external vertical walls, av |
|
p13) |
Thickness of roof, tr [m] |
|
p14) |
Thermal transmittance of roof, Ur [W/m2 K] |
|
p15) |
Solar absorptance of roof, ar |
|
p16) |
Thermal transmittance of windows, glass+frame, Uw [W/m2 K] |
|
p17) |
Solar heat gain coefficient of windows, SHGC |
|
p18) |
Infiltration rate [h-1] |
|
Parameters related to the HVAC Systems |
|
|
p19) |
Heating terminals: fan coils (FC)/ hot water Radiators (Rad) |
|
p20) |
Nominal efficiency of the heating system, η |
|
p21) |
Nominal energy efficiency ratio of the cooling system, EER |
Table 3. Range of variability and type of distribution of the characteristic parameters (pi) for the five building categories
|
|
Range of variability |
Distribution Type |
||||
|
Zone B |
Zone C |
Zone D |
Zone E |
Zone F |
||
|
p1)[-] |
0; ±30; ±60; 90 |
0; ±30; ±60; 90 |
0; ±30; ±60; 90 |
0; ±30; ±60; 90 |
0; ±30; ±60; 90 |
uniform |
|
p2)[m2] |
100÷1000 |
100÷1000 |
100÷1000 |
100÷1000 |
100÷1000 |
uniform |
|
p3)[-] |
1.00÷10.0 |
1.00÷10.0 |
1.00÷10.0 |
1.00÷10.0 |
1.00÷10.0 |
uniform |
|
p4)[m] |
2.70÷4.20 |
2.70÷4.20 |
2.70÷4.20 |
2.70 ÷4.20 |
2.70 ÷4.20 |
uniform |
|
p5)[-] |
0.10÷0.50 |
0.10÷0.45 |
0.10÷0.40 |
0.10 ÷0.40 |
0.10 ÷0.35 |
uniform |
|
p6)[-] |
0.10÷0.50 |
0.10÷0.45 |
0.10÷0.40 |
0.10 ÷0.40 |
0.10 ÷0.35 |
uniform |
|
p7)[-] |
0.10÷0.50 |
0.10÷0.45 |
0.10÷0.40 |
0.10÷0.40 |
0.10÷0.35 |
uniform |
|
p8)[-] |
0.10÷0.50 |
0.10÷0.45 |
0.10÷0.40 |
0.10÷0.40 |
0.10÷0.35 |
uniform |
|
p9)[-] |
1÷8 |
1÷8 |
1÷8 |
1÷8 |
1÷8 |
uniform |
|
p10)[m] |
0.20÷0.40 |
0.22÷0.42 |
0.23÷0.43 |
0.25÷0.45 |
0.27÷0.50 |
normal* |
|
p11)[W/m2K] |
1.15÷1.90 |
1.10÷1.80 |
1.05÷1.80 |
1.00÷1.60 |
0.90÷1.55 |
normal* |
|
p12)[-] |
0.10÷0.50 |
0.10÷0.70 |
0.10÷0.80 |
0.10÷0.90 |
0.20÷0.90 |
normal* |
|
p13)[m] |
0.15÷0.28 |
0.16÷0.32 |
0.17÷0.33 |
0.18÷0.34 |
0.20÷0.36 |
normal* |
|
p14)[W/m2K] |
1.60÷2.30 |
1.45÷2.25 |
1.40÷2.15 |
1.35÷2.10 |
1.30÷1.95 |
normal* |
|
p15)[-] |
0.10÷0.50 |
0.10÷0.70 |
0.10÷0.80 |
0.10÷0.90 |
0.20÷0.90 |
normal* |
|
p16)[W/m2K] |
3.50÷6.00 |
3.00÷5.50 |
2.50÷5.50 |
2.00÷5.00 |
1.90÷5.00 |
normal* |
|
p17)[-] |
0.78÷0.82 |
0.76÷0.82 |
0.74÷0.82 |
0.69÷0.82 |
0.67÷0.82 |
normal* |
|
p18)[h-1] |
0.50÷1.00 |
0.50÷1.00 |
0.50 ÷1.00 |
0.50÷1.00 |
0.50÷1.00 |
uniform |
|
p19)[-] |
Fc/Rad |
Fc/Rad |
Fc/Rad |
Fc/Rad |
Fc/Rad |
uniform |
|
p20)[-] |
0.65÷0.90 |
0.70÷0.90 |
0.70÷0.95 |
0.75÷0.95 |
0.75÷0.95 |
normal* |
|
p21)[-] |
2.30÷2.80 |
2.20÷2.80 |
2.20÷2.80 |
2.10÷2.70 |
2.00÷2.60 |
normal* |
*the mean value is the average of the range and the standard deviation is given by (range length)/4 in such a way to provide a confidence interval of 95% [2]
3.2 Investigated ERMs
Some common ERMs are proposed to reduce PEC. These are investigated for the whole building stock and are slightly differentiated depending on the climatic zone, and thus on the building category. The following ERMs are investigated:
Definitely, low-e coatings [17] imply a significant reduction of Uw, and so they are particular effective for cold climates.
Concerning the ERMs (d) and (e), when the AHP and ACH are coupled, the installation of a single reversible air-source heat pump is considered (AHP +ACH). It is noted that most values of IC have been taken from [2]. When not available, they have been obtained from direct quotations of suppliers.
Table 4. Limit (maximum) values of thermal transmittance (Ulim) for accessing to public financial incentives [11]
|
Climatic Zone |
Walls (Uvlim) |
Roof (Urim) |
Windows (Uwim) |
|
B |
0.41 W/m2 K |
0.32 W/m2 K |
2.4 W/m2 K |
|
C |
0.34 W/m2 K |
0.32 W/m2 K |
2.1 W/m2 K |
|
D |
0.29 W/m2 K |
0.26 W/m2 K |
2.0 W/m2 K |
|
E |
0.27 W/m2 K |
0.24 W/m2 K |
1.8 W/m2 K |
|
F |
0.26 W/m2 K |
0.23 W/m2 K |
1.6 W/m2 K |
As for Italian energy policies, the ERMs (a), (b), (c) and (d) are supported by public financial incentives. In particular, a capital grant is accorded in ten years, covering the 65% of the investment cost [11]. However, the following limits subsist:
Therefore, the maximum value of public financial incentive is equal to 90’000 (accorded in ten years) per building. It is highlighted that, as concerns ERM (d), the incentive is provided also for reversible heat pumps, and thus AHP + ACH and GHP. Conversely, the other cooling systems are not supported by public grants, but they are nevertheless investigated because they can imply significant PEC savings, especially in the warmest climatic zones and in presence of envelope thermal insulation (risk of summer overheating [18]).
Finally, the ERMs introduce e = 5 discrete parameters, reported in Table 5. Thus the renovated building stock is defined by n + e = 26 characteristic parameters.
Table 5. Parameters associated to the ERMs
|
ERMs addressed to the Building Envelope |
Options |
|
|
m1) |
Thermal insulation of the walls |
No/ Yes |
|
m2) |
Thermal insulation of the roof |
No/ Yes |
|
m3) |
Installation of energy-efficient windows |
No/ Yes |
|
ERMs addressed to the HVAC systems |
Options |
|
|
m4)) |
Type of primary heating system |
RB/ CB/ AHP/ GHP |
|
m5) |
Type of primary cooling system |
RC/ ACH/ WCH/ GHP |
The proposed methodology is applied to the described Italian office building stock. EnergyPlus simulations are conducted by using a processor Intel® CoreTM i7 at 2.00 GHz. Each energy simulation takes around 60 seconds for the examined building models by implementing the ‘conduction transfer function’ algorithm with 6 time-steps per hour.
Concerning the evaluation of PEC, the conversion factor is assumed equal to 1 for natural gas and to 2.18 for electric energy [2]. On the other hand, for the prediction of EM, the conversion factors provided for Italy in [19] are used: 0.708 tCO2-eq/MWh for electricity 0.237 tCO2-eq/MWh for natural gas. Finally, concerning GC assessment, the adopted electricity price is 0.25 €/kWh and the natural gas price is 0.90 €/Nm3 [20].
All told, the achieved outcomes are shown in the next subsections by following the methodology stages.
4.1 Current energy performance of the building stock
As aforementioned, the investigated office stock is subdivided into five categories, corresponding to the five Italian climatic zones B, C, D, E and F. Hereinafter, the categories are denoted with the letters the identify the associated climatic zones. For each category, a RBS is generated in MATLAB® environment by applying LHS to the characteristic parameters delineated in Tables 2 and 3. As shown in [2], the minimum reliable size of a RBS is around 2.2 times the number of sampled parameters (n). In this case, n is equal to 21 (see Table 2), and therefore the size of the five RBSs is conservatively set equal to 50 building models. The energy performance of each building included in the RBSs (for a total to 50 5 = 250 building models) is simulated in EnergyPlus. Then, a post-process code, written in MATLAB®, provides for each case the values of PEC, GC and EM. The mean values (denoted with the subscript m) of such indicators within the five categories provide a comprehensive picture of the current energy performance of the building stock:
4.2 Impact of ERMs and effectiveness and potential improvements of energy policies
The impact of the proposed ERMs on PEC, GC and EM is assessed. Firstly, an exhaustive sampling is conducted to predict the energy performance of the building models included in the five RBSs in presence of the ERMs addressed to the thermal insulation of the building envelope, i.e., ERMs (a), (b) and (c). The possible combinations of the measures are seven, namely:
The total number of required simulations is 7 50 5 = 1’750 given by the product between the number of retrofit scenarios, the RBSs’ size, and the number of RBSs (thus of building categories). The coupling of EnergyPlus and MATLAB® allows to assess for each case the values of PEC, GC and EM in correspondence of all possible combinations of HVAC systems, reported in Table 5. These combinations are ten, and thus the number of evaluations (without needing further EnergyPlus simulations) is 1’750 10 = 17’500. The outcomes show the cost-optimal energy retrofit solution for each category. This is given by the package of ERMs that produces GC savings for the highest number of category’s members (i.e., building sampled cases).
The procedure is carried out to investigate two scenarios (thus MATALB® evaluations are performed twice), namely;
The comparison between the values of GC achieved in the two scenarios allows to evaluate the effectiveness of current energy policies and to propose guidelines for their enhancement.
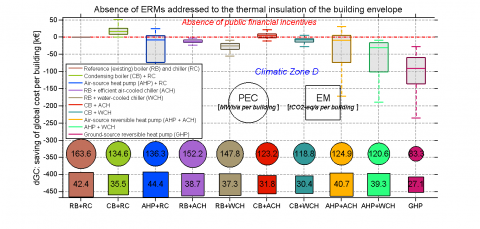
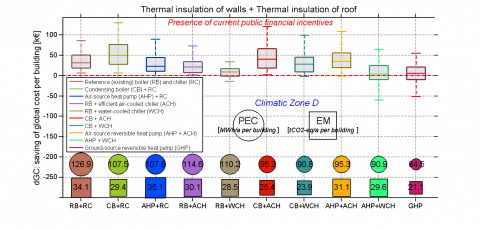
For demonstration purposes, the main outcomes obtained for the category D (chosen because it presents average climatic conditions within the stock) are represented in Figure 1:
The values of dGC are represented instead of GC because they provide a more immediate identification of cost-optimality. Clearly, similar figures are achieved for the other categories. Such figures highlight the cost-optimal solution for each category in the two investigated scenarios.
In absence of public financial incentives for ERMs the following cost-optimal retrofit solutions are achieved:
Conversely, in presence of current Italian incentives for ERMs the following cost-optimal solutions are achieved:
In order to estimate the effectiveness of current incentives from the shown results, an observation is fundamental. The cost-optimal ERMs’ packages are the retrofit solutions that, more likely, will be implemented because they produce the highest economic benefits for the building tenants and/or owners (private perspective). Thus, the aim of public energy policies is making sure that the cost-optimal solutions imply significant energy savings and polluting emissions’ reductions in order to fight energy poverty, energy dependence and climate change (public perspective). Definitely, it is almost never possible to make coincident the cost-optimal solution with the one that yields the highest energy savings, because these would cause excessive public investments in terms of financial incentives. For instance, concerning the investigated category D (see figure 1) the best solution from the public perspective is the GHP, because it produces huge potential PEC savings and EM reductions. However, clearly, this is not cost-effective also in presence of substantial public incentives (65% of the investment). Finally, the cost-optimal solutions determined by public energy policies should provide the best trade-off between private and public perspectives. Definitely, this is a complex issue that needs multi-objective optimization. Nevertheless, the obtained results give an interesting picture of current energy policies that financially support the retrofit of the Italian office stock, which can be exploited to propose generic guidelines to increase the effectiveness of such policies. These guidelines can be differentiated in function of the category, as shown below.
(a)Absence of public financial incentives. Absence of ERMs for the thermal insulation of the building envelope
(b)Presence of current public financial incentives. Absence of ERMs for the thermal insulation of the building envelope
(c)Presence of current public financial incentives. Presence of the cost-optimal combination of ERMs for the thermal insulation of the building envelope
Figure 1. Italian office buildings in climatic zone D. Impact of ERMs on global cost saving (dGC), primary energy consumption (PEC) and polluting emissions (EM) in absence and presence of public financial incentives
Category B: current incentives are effective because they sufficiently support air-source reversible heat pumps, which imply potential mean savings of PEC (dPECm) and EM (dEMm) of 26.0 MWh/a and 7.1 tCO2-eq/a per building, respectively. However, also the mere installation of an efficient ACH has a significant positive impact by producing dPECm of 21.0 MWh/a and dEMm of 6.7 tCO2-eq/a. Nevertheless, this ERM is not cost-effective for most buildings because it does not receive a financial support. Therefore, the energy policies can be improved by granting a financial incentive, even slight, to ACHs. It is noticed that there are more energy-efficient HVAC systems, i.e., WCHs and GHPs, but they should benefit from excessive financial grants to become cost-effective, and thus it is not convenient to support these ERMs. The same conclusion is valid for the thermal insulation of the building envelope, which is not cost-effective and implies small energy and environmental benefits because it causes summer overheating risk.
Category C: current incentives are effective because they sufficiently support air-source reversible heat pumps and thermal insulation of the envelope, which exert a substantial positive impact on energy demand. Indeed, this cost-optimal retrofit package produces dPECm of 43.8 MWh/a and dEMm of 9.4 tCO2-eq/a. Also the installation of CBs is highly cost-effective for most category’s members, and can be preferred to heat pumps when the initial economic availability is limited. When CBs are combined with the thermal insulation of walls and roof, the values of dGC are positive for most buildings, even if they are slightly lower to those provided by the mentioned cost-optimal package. Furthermore, dPECm and dEMm are equal to 28.6 MWh/a and 6.6 tCO2-eq/a, respectively, and therefore the cost-optimal solution, which ensures higher energy and emission savings is better also from the public perspective. Thus, current energy policies ensure excellent results and they do not need to be improved. As argued for category B, other ERMs, even if very energy-efficient, are abundantly not cost-effective, and thus it is not convenient to financially support them.
Category D: current energy policies can be improved. Most notably, incentives addressed to the thermal insulation of the vertical envelope are effective, whereas those addressed to the thermal insulation of the roof and to the installation of CBs are excessive. Indeed, these latter ERMs are cost-effective also in absence of incentives. Conversely, the installation of ACHs should receive a financial support in order to achieve greater energy savings and polluting emissions’ reductions. This would ensure a better trade-off between the mentioned private and public perspectives. In particular, the cost-optimal retrofit package, in presence of current incentives, produces dPECm of 56.1 MWh/a and dEMm of 13.0 tCO2-eq/a (see figure 1(c)). Contrariwise, if ACHs benefit from a financial incentive, even slight, they become part of the new cost-optimal solution, which would imply potential dPECm of 68.4 MWh/a and dEMm of 17.0 tCO2-eq/a (see figure 1(c)). As argued for the previous categories, other ERMs, even if very energy-efficient, are abundantly not cost-effective, and thus it is not convenient to financially support them.
Category E: current energy policies can be improved. Most notably, incentives addressed to the thermal insulation of the opaque building envelope and to the installation of CBs are excessive, because these ERMs are cost-effective also in absence of incentives. Conversely, the installation of GHPs and of energy-efficient windows should receive a higher financial support in order to achieve greater energy savings and polluting emissions’ reductions. In particular, the cost-optimal retrofit package, in presence of current incentives, produces dPECm of 82.4 MWh/a and dEMm of 19.4 tCO2-eq/a. Contrariwise, if GHPs and energy-efficient windows benefit from higher financial incentives, even not overly, they become part of the new cost-optimal solution (the GHPs replace the CBs), which would imply potential dPECm of 141.8 MWh/a and dEMm of 30.7 tCO2-eq/a. It should be noticed that AHPs are not effective because of the very rigid climatic conditions, which cause a worsening of energy performance.
Category F: current energy policies can be improved. Most notably, incentives addressed to the installation of new windows are effective, whereas those addressed to the thermal insulation of the opaque building envelope and to the installation of CBs are excessive. Indeed, these latter ERMs are cost-effective also in absence of incentives. Conversely, the installation of GHPs should receive a higher financial support in order to achieve greater energy savings and polluting emissions’ reductions. In particular, the cost-optimal retrofit package, in presence of current incentives, produces dPECm of 117.2 MWh/a and dEMm of 27.7 tCO2-eq/a. Contrariwise, if GHPs benefit from higher financial incentives, even not overly, they become part of the new cost-optimal solution (the GHPs replace the CBs), which would imply potential dPECm of 166.5 MWh/a and dEMm of 34.7 tCO2-eq/a. Also in this case, AHPs are not effective because of the very rigid climatic conditions..
Definitely, as shown by the reported outcomes, the wide implementation of the proposed methodology can imply huge energy, economic and environmental benefits at large scale. Indeed, it would provide effective energy policies able to produce the best trade-off between the private and public perspectives in name of sustainability.
The paper proposes a methodology to investigate the energy retrofit of a wide building stock. The main goals are:
The methodology subdivides the investigated building stock into homogeneous categories, each of them characterized by the same use destination, construction type and climatic location. Each category is represented by generating a representative building sample (RBS) through Latin hypercube sampling. Then, the energy performance and the retrofit potentials of the RBSs are assessed by means of the automatic coupling between MATLAB® and EnergyPlus.
For demonstration purposes, the Italian office building stock has been investigated and subdivided into five categories, corresponding to the main Italian climatic zones, namely B, C, D, E, and F. The implementation of common ERMs, most of them financially supported by Italian energy policies, has been explored. The following main outcomes have been achieved concerning the energy retrofit of the mentioned categories:
The application of the proposed guidelines would highly increase the effectiveness of Italian energy policies that support building retrofit, thereby producing huge energy, economic and environmental benefits at large scale. However, these guidelines are generic, whereas a throughout and comprehensive definition of energy policies requires to solve a complex multi-objective optimization problem, in order to find the optimal trade-off between the public and private perspectives. Further studies will carefully address this optimization problem by employing multi-objective optimization algorithms, such as genetic algorithms [5] or particle swarm optimization [21]. Finally, it is highlighted that a rigorous investigation of the energy performance of building stocks should also consider urban scenarios and inter-building effects [22]. Future studies will take into account this issue, too.
|
ACH |
efficient air-cooled chiller |
|
AHP |
air-source heat pump |
|
a |
absorption coefficient to solar radiation |
|
BPS |
building performance simulation |
|
CB |
condensing boiler |
|
COP |
heat pumps’ nominal coefficient of performance |
|
c |
number of categories in which the building stock is subdivided |
|
dEM |
EM saving, CO2-eq/a per building |
|
dGC |
GC saving, € per building |
|
dPEC |
PEC saving, Wh/a per building |
|
EER |
chillers’ nominal energy efficiency ratio |
|
EM |
polluting emissions for space conditioning needs, CO2-eq/a per building |
|
ERM |
energy retrofit measure |
|
e |
number of parameters related to the ERMs |
|
GC |
global cost for space conditioning needs, € per building |
|
GHP |
ground-source reversible heat pump |
|
HDD |
heating degree day, °C day |
|
HVAC |
heating, ventilating and air conditioning |
|
IC |
investment cost, € |
|
LHS |
Latin hypercube sampling |
|
mi |
i-th parameter related to the ERMs |
|
N |
number of cases included in the RBS |
|
n |
number of buildings’ characteristic parameters |
|
P |
thermal capacity, kW |
|
PEC |
primary energy consumption for space conditioning needs, Wh/a per building |
|
pi |
i-th buildings’ characteristic parameter |
|
RB |
reference boiler |
|
RBS |
representative building sample |
|
RC |
reference chiller |
|
SA |
sensitivity analysis |
|
SLABE |
simulation-based large-scale uncertainty/ sensitivity analysis of building energy performance |
|
SHGC |
solar heat gain coefficient |
|
TED |
thermal energy demand, Wh |
|
t |
thickness, m |
|
U |
thermal transmittance, W/m2 K |
|
WCH |
water-cooled chiller |
|
Greek symbols |
|
|
η |
boilers’ nominal efficiency referred to the low calorific value |
|
Subscripts |
|
|
c |
referred to the cooling season |
|
h |
referred to the heating season |
|
i |
referred to the thermal insulation |
|
m |
mean value within the RBS (i.e., category) |
|
r |
referred to the roof |
|
v |
referred to the vertical external walls |
|
w |
referred to the windows |
[1] Z. Ma, P. Cooper, D. Daly and L. Ledo, “Existing building retrofits: Methodology and state-of-the-art,” Energy and Buildings, vol. 55, pp. 889-902, 2012. DOI: 10.1016/j.enbuild.2012.08.018.
[2] G. M. Mauro, M. Hamdy, G. P. Vanoli, N. Bianco and J. L. M. Hensen, “A new methodology for investigating the cost-optimality of energy retrofitting a building category,” Energy and Buildings, vol. 107, pp. 456-78, 2015. DOI: 10.1016/j.enbuild.2015.08.044.
[3] EU Commission and Parliament. Directive 2010/31/EU of the European Parliament and of the Council of 19 May 2010 on the energy performance of buildings (EPBD Recast).
[4] EU Commission. Commission Delegated Regulation (EU) No 244/2012 of 16 January 2012 supplementing Directive 2010/31/EU of the European Parliament and of the Council on the energy performance of buildings.
[5] F. Ascione, N. Bianco, C. De Stasio, G. M. Mauro and G. P. Vanoli, “Multi-stage and multi-objective optimization for energy retrofitting a developed hospital reference building: A new approach to assess cost-optimality,” Applied Energy, vol. 174, pp. 37-68, 2016. DOI: 10.1016/j.apenergy.2016.04.078.
[6] B. Poel, G. V. Cruchten and C. A. Balaras, “Energy performance assessment of existing dwellings,” Energy and Buildings, vol. 39, pp. 393-403, 2007. DOI: 10.1016/j.enbuild.2006.08.008.
[7] A. B. deVasconcelos, M. D. Pinheiro, A. Manso and A. Cabaço, “A Portuguese approach to define reference buildings for cost-optimal methodologies,” Applied Energy, vol. 140, pp. 316-28, 2015. DOI: 10.1016/j.apenergy.2014.11.035.
[8] M. Hamdy, A. Hasan and K. Siren, “A multi-stage optimization method for cost-optimal and nearly-zero-energy building solutions in line with the EPBD-recast 2010.” Energy and Buildings vol. 56, pp. 189-203, 2013. DOI: 10.1016/j.enbuild.2012.08.023.
[9] E. Pikas, J. Kurnitski, R. Liias and M. Thalfeldt, “Quantification of economic benefits of renovation of apartment buildings as a basis for cost-optimal 2030 energy efficiency strategies,” Energy and Buildings, vol. 86, pp. 151-60, 2015. DOI: 10.1016/j.enbuild.2014.10.004.
[10] C. H. Baek and S. H. Park, “Changes in renovation policies in the era of sustainability,” Energy and Buildings, vol. 47 pp. 485-96, 2012. DOI: 10.1016/j.enbuild.2011.12.028.
[11] Italian Parliament, Law 28/12/2015, n. 208. [in Italian]
[12] US Department of Energy. Energy Efficiency and Renewable Energy Office, Building Technology Program (2013), EnergyPlus 8.0.0. Available at: http://apps1.eere.energy.gov/buildings/energyplus/.
[13] MATLAB®- MATrixLABoratory (2010) - 7.10.0. User's Guide. MathWorks.
[14] M. Citterio, “Analisi statistica sul parco edilizio non residenziale e sviluppo di modelli di calcolo semplificati” [“Statistical analysis on the non-residential building stock and development of simplified calculationtools”], Report RSE/2009/161, ENEA, Cresme Ricerche Spa e Ministero dello Sviluppo Economico, 2009. [in Italian]
[15] Available at: //apps1.eere.energy.gov/buildings/energyplus/weatherdata_about.cfm/.
[16] A. Genco, A. Viggiano, G. Rospi, N. Cardinale, V. Magi, “Dynamic modeling and simulation of buildings energy performance based on different climatic conditions,” International Journal of Heat and Technology, vol.33, no. 4, pp. 107-116, 2015. DOI: 10.18280/ijht.330414.
[17] M. Cucumo, V. Ferraro, D. Kaliakatsos and V. Marinelli, “Simulation of the thermal behaviour of buildings equipped with low-emissivity glazed components. A performance analysis,” International Journal of Heat & Technology, vol. 31, pp. 111-118, 2013. DOI: 10.18280/ijht.310215.
[18] F. Ascione, N. Bianco, C. De Stasio, G. M. Mauro and G. P. Vanoli, “Dynamic insulation of the building envelope: Numerical modeling under transient conditions and coupling with nocturnal free cooling,” Applied Thermal Engineering, vol. 84, pp. 1-14, 2015. DOI: 10.1016/j.applthermaleng.2015.03.039.
[19] Technical annex to the SEAP template instructions document: THE EMISSION FACTORS. Available at: //www.eumayors.eu/IMG/pdf/technical_annex_en.pdf/.
[20] Available at: //www.energy.eu/.
[21] N. Delgarm, B. Sajadi, F. Kowsary and S. Delgarm, “Multi-objective optimization of the building energy performance: A simulation-based approach by means of particle swarm optimization (PSO),” Applied Energy, vol. 170, pp. 292-303, 2016. DOI: 10.1016/j.apenergy.2016.02.141.
[22] C. Delmastro, G. Mutani, L. Schranz and G. Vicentini, “The role of urban form and socio-economic variables for extimating the building energy savings potential at the urban scale,” International Journal of Heat and Technology, vol. 33, no. 4, pp. 91-100, 2015. DOI: 10.18280/ijht.330412.