OPEN ACCESS
Energy rational use has been extensively studied in the past fifty years but the challenge of optimal use of energy resources continues. This paper is about artificial grain drying, an intensive energy consuming industrial process. Constructal Theory guided the search of the superior limits of grain drying. By maximizing the utilization of drying gas moisture removal and carrying capability, we address the fundamental problem of determining the best strategies to minimize the specific energy consumption. Results shed some light on sizing drying chambers for given conditions. The drying gas moisture carrying capability almost doubled while the drying gas mass flow rate decreased six times. Numerical values of thermal efficiency indicate a potential improvement of the grain drying process from 14.28% for constant drying air delivery, up to 27.53% when the best variable drying air delivery strategy is employed.
Grain drying, Constructal theory, Energy efficiency.
Energy related environmental issues are among the main concerns and policies in the world. Harvested grains, whether for food or feedstock for biofuel production, require energy for proper handling and storage. Grain drying follows harvest in order to sustain the main properties of the grains during the storage period and often again for further industrial processing (e.g., oil mills). The moisture content must be reduced to specified levels established for each kind of grain (e.g., [1, 2]). One of the major challenges is to carry out proper drying with productivity that meets the seasonal concentrated demand during the harvest season with the least energy expenditure.
Most of the large grain crops are dried artificially. Artificial drying takes place when the drying gas, most often ambient air, is heated and blown on the grains [3]. The process usually takes place in equipment or units called dryers. Dryers continue to be a topic of interest for either to improve quality [4, 5, 6], productivity [7] or energy efficiency [5, 7, 8].
Drying aims to remove only free water from the grains. Water at the surface is transferred to air by external convection. The latter process creates conditions for water to move from inner parts of the grain to the outer surface in a diffusive process.
An increase in temperature on the grain’s outer surface leads to a local decrease in the partial pressure of water in the air film surrounding the grain. This, in turn enhances water (moisture) mass transfer potential. This process enhances outward diffusion of water until equilibrium between partial pressures is achieved. This effect suggests that there may be two controlling mechanisms of the drying process, namely, the external convection and the internal diffusion. When the two flows do not match, either energy is wasted or grains are improperly dried (e.g., over drying, seedcoat cracks).
The heat and mass transfer in the drying process have been modelled in many ways and for different types of dryers and materials [4, 5, 7-9, 11-14]. Grains are not dried individually; they are packed forming a porous medium [17]. The drying process can be modelled as thin layer, or as deep bed [4, 5, 7, 8, 13 and 14]. The internal diffusion can be detailed [4, 15] or treated empirically [6, 11, 12]. Convection in the porous medium can be modelled [4, 13] or also be treated empirically [5, 6].
Beyond the understanding of the phenomena present in a dryer, there is the design of dryers itself. We investigate the limits and conditions in which a dryer design may evolve. We consider Design with Constructal Theory [16], which is based on the Constructal Law: “For a finite-size system to persist in time (to live), it must evolve in such a way that it provides easier access to the imposed currents that flow through it”.
Overall, one expects a dryer design that would provide higher productivity, quality and less energy expenditure.
In the present case, the finite-size system is the finite-size dryer that drives the moisture from the grains to flow to ambient air in a finite-time. With a specified productivity and quality, the prevailing designs will be the ones that most facilitate the transfer of moisture from the grains to the air. Ultimately, they will be the designs that require the least energy effort.
The energy expenditure is related to the drying gas mass flow rate when an operating temperature is specified.
A first design step is to consider only regimes that sustain a balance between internal mass diffusion and external convection mass transfer in the soybeans packed bed.
In this paper we address the fundamental problem of how to deliver the minimum drying gas mass flow rate to the drying chamber while holding the balance between internal mass diffusion and external convection mass transfer.
We perform additional two steps in the design. First the geometry (height and length) of the drying chamber is determined and later we calculate the distribution of mass flow rate of the drying gas along the column.
We use a model of a continuous mixed-flow grain dryer and soybeans as an example. The objective function to be maximized is the drying air specific humidity in kilograms of vaporized moisture per kilograms of drying gas.
The thermodynamic model considers mass balance for grains, dry air and water and energy balance equations, as well as empirical relations for the hygroscopic kinetics. The single column bed is divided into finite size elemental cells (control volumes).
The resulting mathematical model is non-linear and it is solved numerically by an iterative procedure.
Results showed that it is possible to determine the appropriate geometry of a drying column as well as to deliver drying air to achieve nearly 27.5% of thermal efficiency to dry soybeans by mixed-flow dryers.
There is a major gain when drying air mass flow is selectively distributed along the column.
The result is a contribution to establish operating limits for finite-time and finite-size drying units and how the design of grain dryers can evolve.
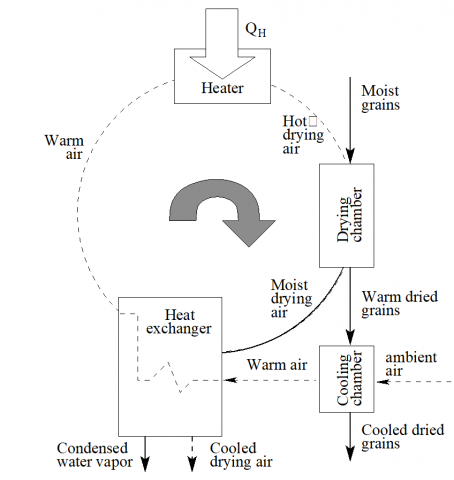
The continuous mixed-flow grain dryer works in a sequence of unit processes that can be separated into four control volumes, namely, a heater, a drying chamber, a heat exchanger and a cooling chamber (Fig. 1).
Energy input takes place at the heater where the drying air is heated up to a prescribed temperature. The hot drying gas stream meets the moist grains stream in the drying chamber. Grains then follow to the fast cooling chamber where they are brought to near ambient temperatures (this step is necessary in order to prevent re-absorption of moisture). Some dryers may recover heat at the cooling chamber and also in a second heat exchanger. In the heat exchanger, residual sensible and latent heat of the humid air from the drying chamber are transferred to the warmed air that has just cooled the grains or air intake from the ambient.
Continuous mixed-flow grain dryers make use of gravity to move grains throughout the drying chamber, but it requires energy to elevate them. Typically an external bucket elevator system moves the grains to the top of the dryer.
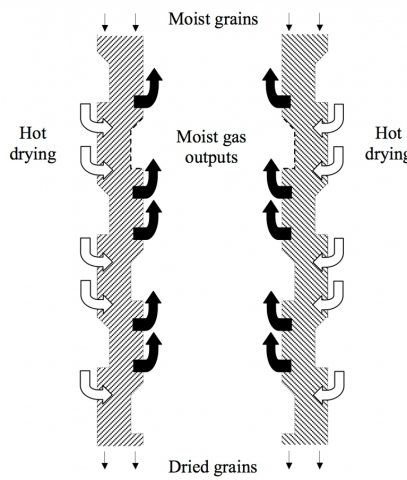
Figure 2 illustrates the core of the drying chamber of a continuous mixed-flow grain dryer. As shown in Fig. 2, moist grains crosses the drying chamber nearly vertically while hot drying gas flows horizontally. The process throughout the drying chamber reduces the grains moisture content and also increases the temperature of the grains.
Figure 1. The sequence of unitary processes into a continuous mixed-flow grain dryer
During the process of moisture removal, some of the internal energy of the hot, low relative humidity drying gas is used to evaporate the grains liquid water content. Often not all enthalpy content of the hot air is spent in the drying process.
In order to increase the energy efficiency of the whole drying plant, some of the internal energy of the humid air that leaves the drying chamber is recovered in the heat exchanger as outlined in Fig. 1. Inside the heat exchanger the air stream gradually increases its temperature to then go through the heater. Streams are not mixed in this heat exchanger.
Warm recent dried grains may spontaneously pick up moisture from the atmosphere later during the storage, and for that reason they must be quickly cooled down. That process requires a cooling chamber that is placed right after the drying chamber.
The cooling chamber presents itself as another energy recovery opportunity: some of the grains internal energy can be transferred to the ambient air intake before it enters the heat exchanger.
The drying chamber is the core of a drying plant, and it is under scrutiny.
2.1 Continuous mixed-flow grain dryer physical model
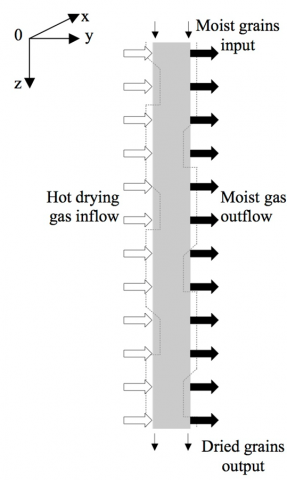
We turn our attention to the grains moisture removal process inside the drying chamber (Fig. 2). The internal design of the drying chamber as well as the grains and drying gas streams shown in Fig. 2 may be decomposed into a repetitive pattern of many adjacent elemental drying chambers, as shown in Fig. 3. The physical model employed in this paper is thus represented by the simple column-drying chamber in Fig. 4. It represents a three-dimensional domain crossed vertically by the moving bed of grains and horizontally by the drying gas flow.
Figure 2. Internal architecture of a continuous mixed-flow column-drying chamber (□ represents the hot dry air inputs and ■ represents the moist air outputs)
2.2 Continuous mixed-flow grain dryer physical model
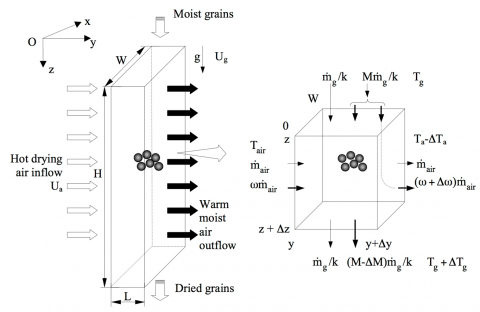
We consider the simple column-drying chamber shown in Fig. 5 with fixed dimensions of width (W), variable length (L) and height (H).
Figure 3. The repetitive structure of adjacent elemental drying chambers
Input of uniform and constant moist grains takes place at the top of the chamber in also constant and uniform mass flow rate. Drying gas enters the left of the column in a specified uniform temperature T*.
The drying process reduces the grains moisture content (kg water/kg dry solid) from a specific initial value M0 (at the top) to a final specified value Mf (at the bottom). The grain bed, consisting of grains at their bulk density rg, slowly moves downward by gravity. The grain bed’s linear velocity Ug is aligned with Oz direction while the hot drying air cross-flow is aligned with Oy direction. Both the grain bed’s velocity and the hot drying air velocity, Ug and Ua, are assumed constant.
Convective mass and heat transfer coefficients in the outer surface of the grains vary little with both linear velocities held constant [9].
Figure 4. The physical model represented by the simple column-drying chamber
The mathematical problem consists of computing the temperature of the grains, the temperature of the drying gas, the grains’ moisture content as well as the drying gas humidity distributions throughout the L × H domain (a unitary vertical slice).
Additional hypotheses are stated below:
The mathematical model employed in this paper derives from the equations of mass and energy conservation applied throughout the simple column-drying chamber. In order to discretize the domain, a three-dimensional coupled finite control-volumes scheme was used as shown in Fig. A.1. The dimensions of the elemental finite control volume are W = 1, Dy = Ua ´ Dt, Dz = Ug ´ Dt as shown in Fig. 5.
Figure 5. Discretization of the physical domain into elemental control volumes
2.2.1 Continuous mixed-flow grain dryer physical model The flow of moist grains in the elemental control volumes is treated as two different streams, namely, the dry solid material and the liquid water (Fig. 5).
The mass flow rate of the grain solid material $\dot{m}_{g}$ is constant along the simple column drying chamber while the mass flow rate of liquid water (moisture)$\dot{m}_{w}=\dot{m}_{g} M$ undergoes reduction due to grains water loss. Since the mass conservation of the grains solid material and the dry air is guaranteed beforehand, the mass conservation is written down by considering only the conservation of the grains water content. Based on grain average moisture content M, the mass conservation principle for the elemental finite control volume in Fig. 5 is written as Eq. (1),
$\Delta M=\tilde{m} \Delta \omega$(1)
where DM is the grain average moisture content variation, $\tilde{m}=\dot{m}_{a i r} /\left(\dot{m}_{g} / k\right),$ and $\quad \dot{m}_{a i r}$ represents the constant mass flow rate of dry air entering the elemental finite control volume and Dw gives the drying air specific humidity variation.
The grain average moisture content M in a given time can be obtained by the diffusive model in Eq. (2), here used to describe the drying kinetics of grains [19].
$\frac{M-M_{e q}}{M_{0}-M_{e q}}=\frac{6}{\pi^{2}} \sum_{m=1}^{\infty} \frac{1}{m^{2}} \exp \left(-\frac{4 \pi^{2} m^{2} D_{e f^{\prime}} t}{d^{2}}\right)$(2)
with Def representing the effective mass diffusivity of water inside the grain, d stands for the mean diameter of grains and t the residence time. The equilibrium moisture content of grains Meq indicates the lower grains moisture content for some given conditions of drying gas humidity and temperature. In the section (3) we present Meq and Def that will be defined in Eqs. (5) and (6), respectively.
2.2.2 Energy balance equation In view of the hypotheses presented previously in this section, the energy balance for each one of the elemental control volumes shown in Fig. 5 can be expressed as Eq. (3):
$\left(\mathcal{C}_{p g}+M c_{p w}\right) \Delta T_{g}+\left[h_{w}\left(T_{a}\right)-c_{p w} T_{g}\right] \Delta M-\tilde{m}\left[c_{p a}+\omega h_{w}^{\prime}\left(T_{a}\right)\right] \Delta T_{a}=0$(3)
where cpg, cpw and cpa respectively represent the specific heat at constant pressure of the grains solid material, of the liquid water inside the grains and of the dry air; Tg and Ta respectively indicate the temperature of the grains solid material and its liquid water content and the drying air temperature; hw stands for the mass specific enthalpy of the slightly superheated water vapor and $h_{w}^{\prime}=d h_{w} / d T$ its first derivative. The last two variables are known functions of temperature.
Equation (3) was written down assuming no mechanical interaction between the elemental control volume in Fig. 5 and its surroundings. Also kinetic energy or potential energy variations are negligible.
We also consider the approximation of water slightly superheated-vapor properties by the saturated-vapor properties at the same temperature in order to calculate the mass specific enthalpy of the water vapor [20].
The numerical procedure is presented in the appendix for the sake of the paper layout.
In section 4 we present the results of two simulations, namely, with constant and variable drying air dimensionless mass flow rate along the drying column.
Typical values for industrial soybeans dryers operation considered in this paper are the initial grains moisture content M0 = 22% (dry basis) and the final moisture content Mf = 15% (dry basis), the atmospheric conditions T0 = 20 0C, P0 = 105 Pa, j0 = 60 %, w0 = 0.0089 and the drying gas temperature T* = 90 0C at the drying chamber inlet, also d = 0.006 m the mean equivalent diameter of soybeans.
The optimization of the dryer required supplemental calculations for variable drying air mass flow rate in order to discover the best possible gas delivery along the Oz direction. That is, a way that the use of the drying gas moisture removal and carrying capability is maximized along the column.
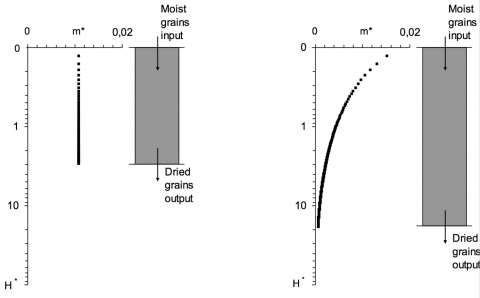
Figure 6. Strategy to maximize the utilization of the drying gas moisture removal and carrying capability (a - constant and b - variable drying gas mass flow rate delivering)
The charts in Fig. 6 show the geometry of the drying column and the drying gas mass flow rate when (a) it is constant and (b) when it varies in order to maximize the utilization of drying gas moisture removal and carrying capability.
The parameter m* represents the fraction of overall drying air mass flow rate delivered for each slice:
$m^{*}=\dot{m}_{a i r, i} / \sum_{\ell=1}^{n} \dot{m}_{a i r, \ell}$(12)
For the constant drying gas mass flow rate case we determined the best value of $\dot{m}_{\text {air}}$ in regard to the first horizontal slice and then held it constant for all horizontal slices, while for the variable drying gas mass flow rate delivery case we determined an optimal value $\dot{m}_{\text {air}}$ for each slice.
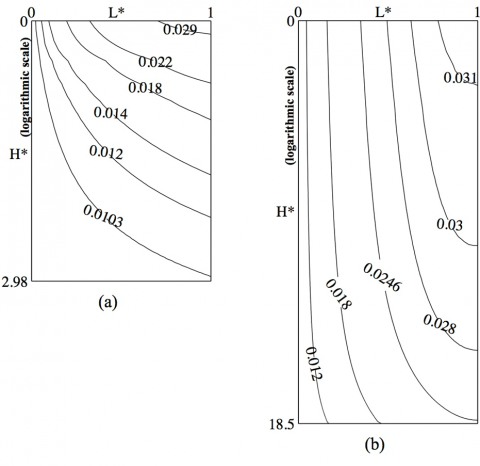
The effectiveness of the drying strategies can be further understood by looking at the variation of the air moisture gain in both cases. It is expressed by the hot drying gas specific humidity w throughout the simple column-drying chamber in the charts of Fig. 7. There, we plotted the iso-humidity lines, w = constant. The higher the value, the higher the moisture gain in the air, since the inlet humidity is given by w0 along the entire column. The other parameters used in the charts are defined as H*= Ug´t/(Ug´t*) = t/t*, L*=1 and the drying time t* is determined according to Eqs. (13)-(15).
$\frac{M_{f}-M_{e q}}{M_{0}-M_{e q}}=\frac{6}{\pi^{2}} \sum_{m=1}^{\infty} \frac{1}{m^{2}} \exp \left(-\frac{4 \pi^{2} m^{2} D_{e f} t^{*}}{d^{2}}\right)$(13)
$M_{e q}=\left[-\frac{\exp \left(3.02-0.00672 T_{0}\right)}{\ln \varphi_{0}}\right]^{1 / 1.508}$(14)
$\frac{D_{e f}}{(d / 2)^{2}}=8.64 \exp \left(-\frac{4848.5}{T^{*}+273.15}\right) \exp \left(3.8 M_{0}\right)$(15)
The iso-humidity lines shown in Fig. 7a indicates that when the airflow rate is uniform, the specific moisture gain in more than three-fourths of the drying chamber is below 0.0091 (0.018 – 0.0089) kilogram of water vapor for each kilogram of dry air. In some portions of the chamber (nearly one fourth) the moisture gain is almost insignificant, that is w » w0.
Figure 7. Internal distribution of hot drying gas specific humidity (w - kg of water/kg of dry air) throughout the actual (a) and the optimized dryer (b)
On the other hand, the effectiveness of the optimized air delivery can be appreciated by looking at the higher values of w across the chamber of Fig. 10b and also by the progressive increase along the horizontal direction. For instance, at halfway point of the horizontal pass, the airflow reaches w = 0.0246 along the entire vertical slice, whereas with the constant flow rate it only reaches that level in the top-right corner of the chamber.
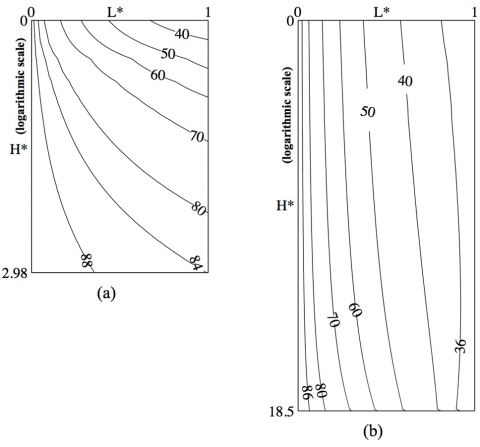
Another way to look at the performance of both gas delivery strategies is in regard to enthalpic (energetic) variation along the drying chamber. That is shown directly based on the temperature of the gas with the aid of isotherm lines (Fig. 8).
In the uniform airflow case (Fig. 8a), a large amount of drying gas leaves the drying chamber at temperatures between 35 °C and 84 °C. That strongly suggests that part of the energy used to heat up the drying gas was wasted since the ambient temperature was 20 °C and the inlet temperature was 90 °C after heating efforts.
In Fig. 8b one can notice that enthalpy of the hot gas is evenly used. That is, the isotherm lines are almost vertical and all the airflow leaves the chamber with temperatures lower than 36 °C.
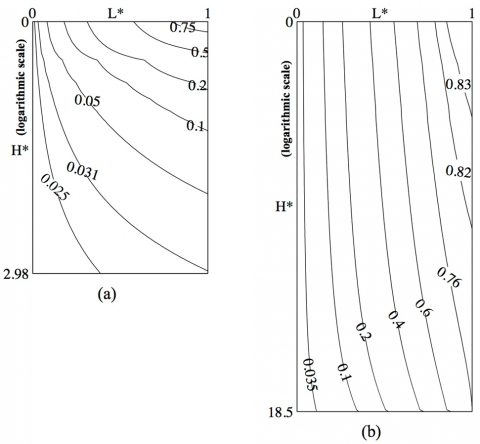
The moisture carrying capability of the drying air can be seen by the relative humidity (j) internal distribution throughout the simple column dryer that is shown in Fig. 9. The relative humidity of an air and water vapor mixture varies with temperature and the amount of water content, thus resulting in energy and mass transfer that take place in the drying chamber.
Figure 8. Internal distribution of hot drying air temperature (Ta in 0C) throughout the actual (a) and the optimized dryer (b)
In regard to the potential of mass transfer, lower values in the charts of Fig. 9 indicate larger moisture transfer potential (an increase in temperature of the ambient air reduces its relative humidity). In regard to how effective is the process within the drying chamber, the higher the value at the outlet, the better balance between the moisture removal and the enthalpy (energy) use. The top limit value is given by local hygroscopic equilibrium conditions.
The chart in Fig. 9a, in which the airflow was uniform, confirms and summarizes the trends shown in the charts of Fig. 7a and 8a: that a large amount of hot drying gas is not properly used to carry grains moisture. Almost all the airflow leaves the drying chamber with values below 20% of the relative humidity.
Figure 9. Hot drying gas relative humidity (j) internal distribution throughout the actual (a) and the optimized dryer (b)
Values of j in Fig. 9b indicate that the variable drying gas delivery strategy optimization of the drying chamber is effective in order to maximize the utilization of the drying gas moisture removal and its carrying capability. At the outlet, all the airflow reaches 76% or higher of relative humidity.
The lower limit for the air outlet temperature is directly related to the amount of moisture absorbed by it, while the higher limit for the air relative humidity is determined by the used potential of moisture removal.
After looking at the three indicators of how the hot air exchanges water and energy throughout the single column dryer chamber, we finally can take a look at the grains’ side.
Numerical results in Fig. 10 show the grains relative humidity (M) internal distribution throughout the simple column dryer. The constant-M curves in this figure show that the moist grains humidity vary largely at the beginning of the drying process (top), while only small variations occur when low humidity grains get in contact with the drying gas (bottom). This result agrees with experimental data in actual grain dryers.
Figure 10. Internal distribution of grains humidity (M) throughout the actual (a) and the optimized dryer (b)
In sum the optimized vertical distribution of drying air doubled the performance of the uniform distribution and yet it used nearly one sixth of the overall drying air mass flow rate.
We also compared the thermal efficiency, he, of the simple column-drying chamber of both cases of drying air delivery in order to evaluate the contribution of the variable airflow rate along the drying column. The efficiency was calculated by the formulae shown below [22]:
$\eta_{e}=\frac{\sum_{i=1}^{n}\left\{\left(\overline{M}_{i+1}-\overline{M}_{i}\right)\left[h_{w}\left(T_{a i, k+1}\right)-h_{w}\left(T_{g i}\right)\right]+c_{p g} \Delta T_{g}\right\}}{\left(1+\omega_{0}\right) c_{p a}\left(T^{*}-T_{0}\right) \sum_{i=1}^{n} \tilde{m} / k}$(16)
The thermal efficiency of the grain drying process showed improvement from 14.28%, achieved by the uniform drying air flow rate, to 27.53% when the variable and optimized drying air delivery was employed.
In order to improve the energy efficiency of grain drying plants, we addressed the fundamental problem of determining designs that minimize the specific energy consumption via maximizing the utilization of drying gas moisture removal and carrying capability.
We focused on a single column-drying chamber of a mixed-flow dryer. The internal geometry of the drying chamber, the grains flow and drying gas flow were decomposed into a repetitive structure of many adjacent elemental drying chambers. That assumption resulted in a three-dimensional domain crossed vertically by the moving layer of grains and horizontally by the drying gas flow as a simple column-drying chamber.
Following the Constructal Law, we considered that the better designs will be the ones which provide a balance between the outwards water diffusion within the grain and the superficial convective removal of moisture from the grains surface, that is, the moisture flow is facilitated until its upper limit.
Numerical integration of the mathematical model was performed based on a coupled control volumes method. Second Law of Thermodynamics was monitored by checking whether the entropy generated [20] was larger or equal than zero.
We considered a uniform distribution and a variable distribution of drying air mass flow rate along the height of the drying column. The distribution of drying gas absolute humidity and relative humidity, and the drying gas temperature, as well as the grains moisture content throughout the column dryer were computed numerically and presented in charts.
Based on the grain inlet conditions and column length, we determined the drying air mass flow rate for two cases. In the first case, the mass flow rate exits the top layer with all its carrying capability used and its magnitude is applied along the entire column. In this case carrying capability is wasted in all following layers. In the second case the mass flow rate varied along the height in order to ensure minimum (or none) waste of the carrying capability.
The height (H) of the drying column provides residence just enough for the grains to exit the column with the desired moisture content. The height is directly related to drying air mass flow rate magnitude and its variation along the vertical direction. Overall, the drying gas moisture carrying capability almost doubled while the drying gas mass flow rate decreased six times.
When the variable air mass flow rate is delivered the drying time increases six times while the thermal efficiency doubles. A compromise between productivity, installed costs and energy efficiency from the design domain will fit particular needs.
The design domain for other types of grains, inlet temperature and column length can be further estimated after the fundamental contribution presented in this paper.
Besides the drying chamber, the configuration and synthesis of a whole plant presents itself as another opportunity to evolve design in the direction of higher efficiency.
This research was funded by the projects Agrogás I (FINEP/ CTPETRO/ Petrobras/ TBG/ Compagas 0660/01), Agrogás II (FINEP/ CTPETRO/ Petrobras /Spirax-Sarco/ Compagas 0435/04) as well as by MRE’s CAPES fellowship BEX 9576/11-8.
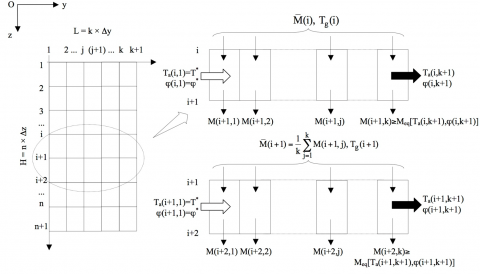
The technique of numerical discretization employed in this work consists in dividing the simple column dryer into n ´ k elemental control volumes of dimensions W ´ L/k ´ H/n, as shown in Fig. A.1. All together, the k elemental control volumes (i, 1£j£k) along the horizontal direction Oy form a W ´ L ´ H/n “horizontal slice”.
The computation starts with the first elemental control volume of the first “slice” (the left top side of the physical domain in Fig. A.1), where the initial grains temperature and moisture content have known values. Our numerical code determines iteratively the variations of drying air temperature and specific humidity, DTa and Dw, until the conditions $\left|\left(\Delta T_{a}^{i t e r+1}-\Delta T_{a}^{i t e r}\right) / \Delta T_{a}^{i t e r+1}\right| \leq 10^{-3} \quad$ and $\left|\left(\Delta \omega^{i t e r+1}-\Delta \omega^{i t e r}\right) / \Delta \omega^{i t e r+1}\right| \leq 10^{-3}$ are met.
Figure A.1. The coupled finite elemental control volumes scheme used to discretize the domain (direction Ox not represented)
Based on resulting DTa and Dw, we calculate the drying air temperature and specific humidity of the drying air leaving the first elemental control volume. They both turn to be the drying air temperature and specific humidity at the inlet of the second elemental control volume. This procedure repeats itself for the whole domain.
Likewise the calculations of the grains bed proceed within each elemental control volume and for the whole domain.
The numerical procedure solved two distinct simulations. The first one is illustrated in Fig. A.2.a, in which the drying gas mass flow rate is uniform across the height of the column. This simulation will be used as reference for an optimization attempt.
The approach to optimize the simple column-drying chamber is outlined in Fig. A.2. It consists of delivering the least drying gas mass flow rate along each “horizontal slice” in such a way that it maximizes the utilization of the drying gas moisture removal and carrying capability.
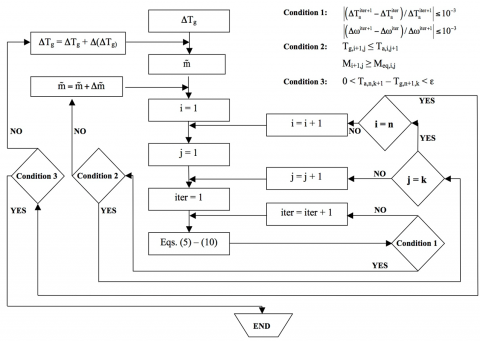
The numerical procedure to obtain the least drying gas mass flow rate starts with a small guess for $\tilde{m}$. The variable $\tilde{m}$ is then progressively increased until the local mass flow rate of grains leaves the elemental control volume with the lowest moisture content.
In every iteration the procedure ensures that the condition of local hygroscopic equilibrium restriction holds, that is, M is always greater than the local Meq.
The temperature of the grains along the Oz direction is assumed to vary linearly [18] and DTg is also an initially guessed parameter. The temperature needs to be adjusted in order to produce the smallest possible temperature difference between the drying air and the dried grains when both exit the drying chamber.
Figure A.2. The constant (a) and the variable (b) drying gas mass flow rate delivering strategies
We consider the Modified Halsey Equation [19] to evaluate the soybeans equilibrium moisture content Meq, Eq. (5) and an Arrhenius type equation for the effective mass diffusivity of water inside the soybeans Def [21], Eq. (6). We then perform a numerical integration of the set of equations (5) to (10) according the algorithm shown in Fig. A.3.
$M_{e q, i, j}^{i t e r}=\left\{-\frac{\exp \left[3.02-0.00672\left(T_{g, i}+\Delta T_{g} / 2\right)\right]}{\ln \left(\varphi_{i, j}+\Delta \varphi_{i, j}^{i t e r} / 2\right)}\right\}^{1 / 1.508}$(5)
$\frac{D_{e f, i, j}^{i t e r}}{(d / 2)^{2}}=8.64 \exp \left[-\frac{4848.5}{\left(T_{a, i, j}+\Delta T_{a, i, j}^{i t e r} / 2\right)+273.15}\right] \exp \left[3.8\left(M_{i}-\frac{\Delta M_{i, j}^{i t e r}}{2}\right)\right]$(6)
$\Delta M_{1, j}^{i t e r+1}=\left(M_{0}-M_{e q, 1, j}^{i t e r}\right)\left[1-\frac{6}{\pi^{2}} \sum_{m=1}^{\infty} \frac{1}{m^{2}} \exp \left(-\frac{4 \pi^{2} m^{2} D_{e f, 1, j}^{i t e r} \Delta t}{d^{2}}\right)\right]$
$\Delta M_{i, j}^{i t e r+1}=\dot{M}\left(t_{i}\right) \Delta t \quad \quad \quad i \geq 2$(7)
$\Delta T_{a, i, j}^{i t e r+1}=\frac{\left(c_{p g}+M_{i} c_{p w}\right) \Delta T_{g}+\left[h_{w}\left(T_{a, i, j}\right)-c_{p w} T_{g, i}\right] \Delta M_{i, j}^{i t e r+1}}{\tilde{m}_{i}\left[c_{p a}+\omega_{i, j} h_{w}^{\prime}\left(T_{a, i, j}\right)\right]}$(8)
$\Delta \omega_{i, j}^{i t e r+1}=\Delta M_{i, j}^{i t e r+1} / \tilde{m}_{i}$(9)
$\Delta \varphi_{i, j}^{i t e r+1}=\frac{\left(\omega_{i, j}+\Delta \omega_{i, j}^{i t e r+1}\right) P}{\left(\omega_{i, j}+\Delta \omega_{i, j}^{i t e r+1}+0.622\right) P_{s a t}\left(T_{a, i, j}-\Delta T_{a, i, j}^{i t e r+1}\right)}-\varphi_{i, j}$(10)
Our code starts with computations for the first (top, left) W ´ L/k ´ H/n control volume (i=1, j=1) and then continuing with the remaining first (top) horizontal slice (i=1, 1≤j≤k).
The temperature of the moist grains that enter each one of the top horizontal slice control volumes is assumed to be equal to the ambient temperature, namely, Tg(1,1) = Tg(1, 1≤j≤k) = T0. Likewise the bulk moisture content $\overline{M}$(1) is given by the initial grains moisture content, that is, M(1, 1≤j≤k) = M0.
The relative and specific humidity of the drying gas at the inlet of the simple column drying chamber (first, left-most vertical slice) j(1,1) = j(1≤i≤n, 1) = j* and w(1,1) = w(1≤i≤n, 1) = w0 are determined based on the atmospheric conditions (T0, P0,j0, w0). That calculation is associated with the w-constant isobaric process that takes place in the heater in order to raise the temperature of drying gas up to T* = Ta(1,1) = Ta(1≤i≤n, 1).
Calculations for the second control volume of the top slice when i=1 and j=2 were based on the same local residence time ∆t and the following initial conditions: Tg(1,2) = T0, M(1,2) = Mi, w(1,2), Ta(1,2) and j(1,2).
New control volumes in the first slice are considered as long as j ≤ k and the moisture contents M(2, j) are greater than the equilibrium moisture contents. That is M(2, j) ³ Meq[Ta(1, j+1), j(1, j+1)]. Calculation along the first horizontal slices stops when j = k and j(1, j+1) @ 1 or M(2,j) @ Meq[Ta(1, j+1), j(1, j+1)].
A new horizontal slice is added to the simple column drying chamber height and computation proceeds based on the same dimensionless drying gas mass flow rate $\tilde{m}$ until $\overline{M}(j+1)=M_{f}$ (j+1)=Mf, when the drying process is finished. The number of horizontal slices, n, will be set as the last value of i.
While $\tilde{m}$ is an initially guessed parameter and its numerical value may be adjusted to determine a certain value of k, the value of n depends on the duration of the drying process. It represents one very important result of this mathematical modelling.
The assumption of thermodynamic equilibrium between solid and liquid phases or between the gaseous phases warrants the temperature of grains solid material and the temperature of its moisture content to be equal to Tg. It also ensures that the temperature of dry air and its water vapor content are also equal to Ta. We consider that the geometry of the drying gas inlets and outlets sketched in Fig. 2 will provide a continuous mixing of grains as they move downward along the column slab model shown in Fig. 4. In order to numerically capture effects of such mixing we assume that the moisture content of all grains entering the (i+1)-th “horizontal slice” is given by the grains bulk moisture content $\overline{M}$(j+1) calculated as the average moisture content of the grains that leave the i-th slice above.
Figure A.3. The constant (a) and the variable (b) drying gas mass flow rate delivering strategies
Empirical data available in the literature [18] indicates that the grains bulk temperature Tg distribution along a simple column drying chamber can be assumed to be a linear function of z. Nevertheless an analytical formulation of Tg(z) must ensure that the drying gas temperature throughout the drying chamber will always be greater than the grains bulk temperature.
In the cases in which we considered a variable drying gas mass flow rate delivery, instead of determining the numerical value of $\tilde{m}$ based on the first slice and then holding it constant for all slices, we determine an optimal value $\tilde{m}_{i}$ for each horizontal slice as suggested in Fig. A.2.
Successive refinements of the local residence time ∆t are used to verify the convergence of the numerical results. The results of a less refined mesh corresponding to ∆t are compared to the results of a finer mesh with a local residence time of ∆t/2. Mesh refinements are considered satisfactory when the relative errors criteria for the drying time and $\tilde{m}_{i}$ were satisfied, namely, $\varepsilon_{t}=\left|\left(t_{\Delta t / 2}-t_{\Delta t}\right) / t_{\Delta t / 2}\right| \leq 0.03$ and
$\left.\varepsilon_{\tilde{m}}=\|\left(\sum_{i=1}^{n} \tilde{m}_{i} / k\right)_{\Delta t / 2}-\left(\sum_{i=1}^{n} \tilde{m}_{i} / k\right)_{\Delta t}\right] /\left(\sum_{i=1}^{n} \tilde{m}_{i} / k\right)_{\Delta t / 2} | \leq 0.002$ (11)
Table A.1. Numerical tests for the convergence of the numerical results for an optimized simple column-drying chamber (Mi = 22%, Mf = 15%, T* = 90 0C, w* = 0.0089)
|
Residence time Dt ( s ) |
Elemental control volumes (n ´ k) |
Drying time t ( s ) |
$\mathcal{E}_{t}$ |
$\sum_{i=1}^{n} \tilde{m}_{i} / k$ |
$\mathcal{E}_{\tilde{m}}$ |
|
120 |
53 ´ 5 |
6,360 |
0.184 |
3.586 |
0,007 |
|
60 |
130 ´ 10 |
7,800 |
0.058 |
3.561 |
0,002 |
|
30 |
276 ´ 20 |
8,280 |
0.029 |
3.569 |
0,002 |
|
15 |
570 ´ 40 |
8,535 |
- |
3.577 |
- |
Table A.1 shows an example of how grid independence was achieved for an optimized simple column-drying chamber.
1. C.W. Vertucci, E.E. Roos, “Theoretical basis of protocols for seed storage,” Plant Physiology, Volume 94, Issue 3, Pages 1019–1023, 1990. DOI: 10.1104/pp.94.3.1019.
2. J. Bazin, D. Batlla, S. Dussert, H. El-Maarouf-Bouteau, C. Bailly., “Role of relative humidity, temperature, and water status in dormancy alleviation of sunflower seeds during dry after-ripening,” Journal of Experimental Botany, Volume 62, Issue 2, Pages 627–640, 2011. DOI: 10.1093/jxb/erq314.
3. T. Kudra, A.S. Mujumdar., Advanced Drying Technologies, 2nd ed., Boca Raton, FL, USA: CRC Press, Taylor & Francis Group, 2009, ISBN-13: 978-1-4200-7387-4 (Hardcover).
4. Chr. Lamnatou, E. Papanicolaou, V. Belessiotis, N. Kyriakis, “Numerical study of the interaction among a pair of blunt plates subject to convective drying – A conjugate approach,” International Journal of Thermal Sciences, Volume 49, Issue 12, Pages 2467-2482, 2010. DOI: 10.1016/j.ijthermalsci.2010.06.017.
5. W. Jindarat, P. Rattanadecho, S. Vongpradubchai, “Analysis of energy consumption in microwave and convective drying process of multi-layered porous material inside a rectangular wave guide,” Experimental Thermal and Fluid Science, Volume 35, Issue 4, Pages 728-737, 2011. DOI: 10.1016/j.expthermflusci.2010.11.008.
6. Maria Valeria De Bonis, Gianpaolo Ruocco, “An experimental study of the local evolution of moist substrates under jet impingement drying,” International Journal of Thermal Sciences, Volume 50, Issue 1, Pages 81-87, 2011. DOI: 10.1016/j.ijthermalsci.2010.08.014.
7. Yan Jin, Xiao Dong Chen, “Entropy production during the drying process of milk droplets in an industrial spray dryer”, International Journal of Thermal Sciences, Volume 50, Issue 4, Pages 615-625, 2011. DOI: 10.1016/j.ijthermalsci.2010.10.013.
8. M.R. Assari, H. Basirat Tabrizi, E. Najafpour, “Energy and exergy analysis of fluidized bed dryer based on two-fluid modeling,” International Journal of Thermal Sciences, Volume 64, Pages 213-219, 2013. DOI: 10.1016/j.ijthermalsci.2012.08.020.
9. M. Fortes, M.R. Okos, “Non-equilibrium thermodynamics approach to heat and mass transfer in corn kernels”, Transactions of the ASAE, Volume 14, Issue 3, Pages 761-769, 1981.
10. M. Fortes, M.R. Okos, J.R. Barrett Jr., “Heat and mass transfer analysis of intra-kernel wheat drying and rewetting”, J. Agric. Eng. Res., Volume 26, Issue 2, Pages 109-125, 1981. DOI: 10.1016/0021-8634(81)90063-9.
11. Fan Geng, Yimin Li, Longji Yuan, Min Liu, Xinyong Wang, Zhulin Yuan, Yaming Yan, Dengshan Luo, “Experimental study on the space time of flexible filamentous particles in a rotary dryer”, Experimental Thermal and Fluid Science, Volume 44, Pages 708-715, 2013. DOI: 10.1016/j.expthermflusci.2012.09.011.
12. P.P. Tripathy, Subodh Kumar, “Neural network approach for food temperature prediction during solar drying”, International Journal of Thermal Sciences, Volume 48, Issue 7, Pages 1452-1459, 2009. DOI: 10.1016/j.ijthermalsci.2008.11.014.
13. B. Remki, K. Abahri, M. Tahlaiti, R. Belarbi, “Hygrothermal transfer in wood drying under the atmospheric pressure gradient”, International Journal of Thermal Sciences, Volume 57, 135-141, 2012. DOI: 10.1016/j.ijthermalsci.2012.02.005.
14. E. Barati, J.A. Esfahani, “Mathematical simulation of convective drying: Spatially distributed temperature and moisture in carrot slab,” International Journal of Thermal Sciences, Volume 56, Pages 86-94, 2012. DOI: 10.1016/j.ijthermalsci.2012.01.003.
15. K. Haghighi, L.J. Segerlind, “Modeling simultaneous heat and mass transfer in an isotropic sphere - A finite element approach”, Transactions of the ASAE, Volume 31, Issue 2, Pages 629-637, 1988.
16. A. Bejan and S. Lorente, Design with Constructal Theory, Wiley, Hoboken, NJ, 2008.
17. D. Nield and A. Bejan, Convection in Porous Media, 2nd ed., New York, NY, USA, Springer, 1998.
18. R.G. Winfield, J. Hart, Reclaiming Heat Energy for Grain Corn Drying. A Report for the Agricultural Energy Centre, Ontario Ministry of Agriculture and Food: Toronto, Ontario M7A 2B2, March, pp. 41, 1983.
19. T.S. Lira, M.A.S. Barrozo, A.J. Assis, “Concurrent moving bed dryer modeling: Sensitivity of physicochemical parameters and influence of air velocity profiles,” Applied Thermal Engineering, Vol. 29, Pages 892–897, 2009.
20. Bejan, Advanced Engineering Thermodynamics, 2nd ed. New York, NY, USA: John Wiley & Sons, Inc., 1997.
21. M.A.S. Barrozo, H.M. Henrique, D.J.M. Sartori, J.T. Freire, “The use of the orthogonal collocation method on the study of the drying kinetics of soybean seeds”, Journal of Stored Products Research, Vol. 42, Pages 348–356, 2006. DOI: 10.1016/j.jspr.2005.06.002.
22. S. Syahrul, F. Hamdullahpur, I. Dincer, “Exergy analysis of fluidized bed drying of moist particles”, Exergy, an International Journal, Vol.2, Pages 87-98, 2002. DOI: 10.1016/S1164-0235(01)00044-9.