OPEN ACCESS
The heat pipe receiver with integrated high temperature latent thermal energy storage is one of the key components of Solar Dynamic Space Power System (SDPSS), among which the evaporation and condensation is the main heat transfer mode, a very complicated two-phase flow. However, research on the two-phase flow and heat transfer characteristics is an effective way to improve the system efficiency and reduce the system mass. So a two-dimensional physical model was built and the volume of fluid (VOF) technique was used to model the interaction between the two phases. The UDF (Users Define Function) was introduced to handle the mass source terms. In the study, the relationship between superheat, subcooling and wall heat flux were investigated. In addition, the flow pattern of bubbles in the tube was analyzed. Compared with the churn bubbles flow, the heat transfer coefficient of the bubbles flow was much higher. Bubble departure diameter increased as surface subcooling increased. The work in this paper lays a good foundation for the further research on the heat transfer characteristics of heat pipe receiver with integrated high temperature latent thermal energy storage.
Two-phase flow, VOF, Evaporation, Condensation, Computational fluid dynamic (CFD).
As a new type of power generation, SDPSS can meet the needs of the high power supplies to space stations with the advantage of high energy conversion efficiency and little frontal area. However, as the key component of SDPSS, the receiver with integrated thermal energy storage accounts for more than one-third of the mass. So reducing the mass of the receiver with integrated thermal energy storage is significant to SDPSS. At present, the heat pipe receiver with integrated high temperature latent thermal energy storage works with stable temperature and high efficiency during the phase change. The mass and volume can be reduced by between 33 % and 77 % of previous values [1].
Heat pipes are widely used in the cooling systems for space electronic equipment and passive cooling systems for the spent fuel pool of nuclear reactors. Heat pipes offer high effective thermal conductivities (5000 - 200,000 W.m-1.K-1), energy-efficiency, light weight, low cost and the flexibility of many different size and shape options [2-8]. So, it can reduce the launch cost and the system mass. As the main heat transfer modes of heat pipe receiver with integrated high temperature latent thermal energy storage, evaporation and condensation play very important roles in the heat transfer process. Despite decades of research, many details of the evaporation and condensation physical processes are still not well revealed [9-12]. To reveal the two-phase flow process of the evaporation and condensation is significant to improving the system efficiency and reducing the cost.
As a complex two-phase flow problem, evaporation and condensation is a complex physical phenomenon which involves fluid flow, heat transfer and mass transfer. The heat transfer of the two-phase flow may be shown as the sensible heat exchange with the change of temperature, and also it may be expressed as the latent heat exchange accompanied with a phase change. In the process of heating or cooling, sensible heat exchange is the heat transfer by conduction or convection due to the temperature difference which does not change the original phase state as the temperature increases or decreases. However, the latent heat exchange is the process in which vapor condenses to liquid with the release of latent heat or where liquid evaporates to vapor with the absorption of latent heat, which is accompanied with the phase change and mass transfer. The nonlinear iterative IMPES scheme developed by El-Amin et al. [13] was used to solve the equation and the transport equation of two-phase flow in a porous medium implicitly, which includes gravity, capillary forces and Brownian diffusion. The work did not involve evaporation and condensation.
Researchers have found it to be extremely difficult to conduct boiling and condensation accurately and effectively by experimental measurements because of the small spatial scales and rapid time constants which are involved in the phase change process. With the rapid development of computer hardware and numerical algorithms in the last decades, numerical simulations have become an important and useful method to investigate this kind of complex phenomenon [14]. The algorithms of either VOF or level-set are considered to be the effective methods to solve the two-phase flow by CFD [15-17].
The VOF algorithm was adopted by Yang et al. [9] to simulate flow boiling with R-141B in a horizontal coiled tube. Compared with the experiment data, the results of the simulation showed good agreement. The typical two-phase flow patterns encountered in a coiled tube are bubbly flow, churn flow, slug flow, stratified flow and wavy flow.
Sharifi et al. [18] built the two-dimensional physical model of a heat pipe-assisted latent heat thermal energy storage, using the CFD to simulate the melting and solidification of a phase change material (PCM) held within a vertical cylindrical enclosure that was integrated with a heat pipe. Parametric studies of the influence of the PCM enclosure height and input/output heat transfer rates were discussed. Kuang et al. [3] simulated the boiling flow in an evaporator of separate type heat pipe with low heat flux using a VOF multiphase flow model. The study on the heat transfer coefficient indicated that nucleate boiling is the dominant mechanism in large pipes at low mass and heat flux, with the heat transfer coefficient being less sensitive to the total mass flux. Alizadehdakhel et al. [19] simulated the wall temperature of a two-phase closed thermosyphon as the different fill ratios and inlet heat flow change by using the VOF model, the result of which was widely cited [20,21]. However, GUO et al. [14] developed the volume of fluid level set (VOSET) method which combined the advantages of both VOF and level set methods to simulate a one-dimensional Stefan problem, two-dimensional horizontal film boiling, and horizontal film boiling of water at near critical pressure. The predicted results in both Nusselt number and flow patterns were agreeable with experimental results available in the literature.
From the above works in the present paper, it shows that the previous works have mainly focused on the boiling process of evaporation. For further study of the evaporation and condensation, this paper built the two-dimensional physical model to study the two-phase flow behavior. The VOF model was carried out to explain the process of evaporation and condensation. Meanwhile, a comparison between the simulation and experiment has also been presented.
In the present study, the numerical simulation of vapor-liquid two-phase flow and heat transfer mainly contains the Particle-trajectory model, Two-fluid model and Tracking technique, among which the Tracking technique can reflect the information of the two phases accurately and comprehensively [22]. However, the VOF model has the advantage that it can track the interface and express physical definition clearly. So, this paper built the two-dimensional physical model of evaporation and condensation in the closed rectangle.
VOF model was proposed by Hirt and Nichols in 1981 [23] as an effective method to solve the two-phase problem.The VOF model can well satisfy the mass conservation requirements [24-26] and the volume fraction $\alpha$ is introduced in VOF, so the sum of the volume fraction of two-phase is equal to 1,
$\alpha_{l}+\alpha_{v}=1$(1)
The mass transfer model concerning the process of evaporating and condensation was built by Lee [27] and was widely used, assuming that the phase change occurred at a constant pressure and at a quasi thermo-equilibrium state, and that the mass transfer was mainly determined by the saturate temperature.
From Eq(2) and Eq(3), the continuity equations of vapor and liquid are respectively:
$\frac{\partial \alpha_{l}}{\partial t}+\vec{v} \cdot \nabla \alpha_{l}=-\frac{S_{\alpha_{l}}}{\rho_{l}}$(2)
$\frac{\partial \alpha_{v}}{\partial t}+\vec{v} \cdot \nabla \alpha_{v}=\frac{S_{\alpha_{v}}}{\rho_{v}}$(3)
Taking the effect of gravity into consideration, the momentum equation is:
$\frac{\partial}{\partial t}(\rho \vec{v})+\nabla \cdot(\rho \vec{v} \vec{v})=-\nabla p+\nabla \cdot\left[\mu\left(\nabla \vec{v}+\nabla \vec{v}^{T}\right)\right]+\rho \vec{g}+\vec{F}_{v o l}$(4)
Finally, the surface tension can be written in terms of the pressure jump across the surface. By introducing the CSF (continuum surface force) model to describe the surface tension [28], so the force of the surface tension can be expressed as $\vec{F}_{v o l}$ :
$\vec{F}_{v o l}=\delta \frac{\alpha_{v} \rho_{v} k_{v} \nabla \alpha_{v}+\alpha_{l} \rho_{l} k_{l} \nabla \alpha_{l}}{0.5\left(\rho_{v}+\rho_{l}\right)}$(5)
where, $\delta$ is the surface tension coefficient and the interface curvature is :
$k_{l}=-k_{v}=-\nabla \cdot\left(\frac{\nabla \alpha_{v}}{\left|\nabla \alpha_{v}\right|}\right)$(6)
The Energy equation is:
$\frac{\partial}{\partial t}(\rho h)+\nabla \cdot(\rho \vec{v} h)=\nabla \cdot(k \nabla T)+S_{\mathrm{E}}$(7)
The enthalpy h and temperature T is taken as the average quality variable in the VOF model. Where:
$h=\frac{\alpha_{l} \rho_{l} h_{l}+\alpha_{v} \rho_{v} h_{v}}{\alpha_{l} \rho_{l}+\alpha_{v} \rho_{v}}$(8)
$h_{l}=C_{l}\left(T-T_{s a t}\right)$(9)
$h_{v}=C_{v}\left(T-T_{s a t}\right)$(10)
To solve the governing equations of the whole computational domain, the velocity field is shared by each phase. The volume fraction of $\rho, \mu$ and $k$ of two-phase that passed the computational domain determines the governing equations. In the two-phase flow system, the$\rho, \mu$ and $k$ in each cell is given by the following Eq(11) and Eq (12), Eq (13) if the volume ratio of a phase is traced:
$\rho=\alpha_{l} \rho_{l}+\alpha_{v} \rho_{v}$(11)
$\mu=\alpha_{l} \mu_{l}+\alpha_{v} \mu_{v}$(12)
$k=\alpha_{l} k_{l}+\alpha_{v} k_{v}$(13)
The heat transfer caused by evaporation and condensation can be expressed by the source term of the Energy equation, which is shown by the following formula. When the temperature of the phase exceeds or falls below the saturation temperature $T_{\text { sat }}$, mass with rate $S_{\alpha}$ transfers and the amount of energy $S_{\mathrm{E}}$ is absorbed or released.
$S_{\mathrm{E}}=S_{\alpha} \Delta H$(14)
Therefore, proper source terms should be added in the governing equations to model the vapor-liquid phase change phenomenon [29-31]. The mass source term is derived from the Hertz-Knudsen equation [32, 33]. For the process of evaporation, the mass source term is:
$S_{\alpha_{l}}=-S_{\alpha v}=\beta_{1} \alpha_{l} \rho_{l} \frac{T-T_{s a t}}{T_{s a t}}, T>T_{s a t}$(15)
During the condensation, the mass source term is:
$S_{\alpha v}=-S_{\alpha_{l}}=\beta_{2} \alpha_{v} \rho_{v} \frac{T_{s a t}-T}{T_{s a t}}, T<T_{s a t}$(16)
The phase transformation rate of the vapor and liquid phase is respectively$\beta_{1}$ and $\beta_{2}$. The basis for setting the variables $\beta_{1}$ and $\beta_{2}$ is the temperature of the calculated grid that contains the phase interface which is constant at saturation temperature. So the proper value of $\beta_{1}$ and $\beta_{2}$ is key to the source term. According to the work of Alizadehdakhel [19], Lee [27], Wu [34] and Schepper et al.[35], both$\beta_{1}$ and $\beta_{2}$ was set to 0.1. However, in Yang [9] and Fang [36], $\beta_{1}$ and $\beta_{2}$was set to 100. Excessively large values of $\beta_{1}$ and $\beta_{2}$ can cause a numerical convergence problem, while too small values lead to a significant deviation between the interfacial temperature and the saturation temperature. So $\beta_{1}$ and $\beta_{2}$ was set to 0.1 in this paper, UDF was introduced to couple with the source term.
The process of the source term is shown in Figure 1. The VOF model was adapted to handle two-phases: one phase was in the non-saturation, that is, in the superheated or subcooling state, and the other was in the saturation that is in saturation state. So to set the $S_{\mathrm{E}}$ and $S_{\alpha}$, the first step was to define the saturation temperature. For evaporation, it happens when the temperature of liquid is higher than the saturation temperature. Otherwise, the liquid is in a subcooling state. As mentioned above, the condensation happens when the vapor temperature is lower than the saturation temperature. Otherwise, the vapor is in a superheated state. At the same time, the evaporation and condensation process is accompanied by energy being absorbed and released.
Figure 1.The set of source term
The experimental results of Reimann and Grigull [37] were chosen to validate the model built in the paper. In our simulation, the heat flux was about 16 W.cm-2 in the case of 30 K superheat boundary condition which was the same as the experiments of Reimann and Grigull [37]. Compared with the experimental result of Figure 2 (a), the simulation result of Figure 2 (b) showed that the bubbles were released individually and sequentially in the low heat flux scenario which qualitatively agreed with Figure 2 (a) very well. The boiling phenomenon and the bubbly distribution near the heated wall agreed with the reference very well.
Figure 2. Comparison results between the experiment result (a) and present simulation results (b)
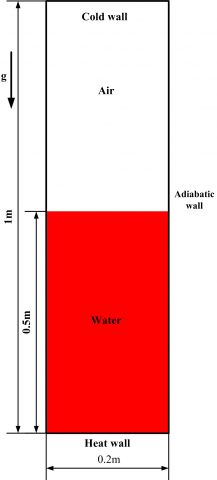
The model is shown in Figure 3. And the computational domain was a two-dimensional closed rectangle, the upper of which was filled with air and the lower, with water. The tube was in vacuum and the droplets dropped by gravity.
4.1 Physical model and initial conditions
Figure 3. Schematic diagram of model
To the regular model, a quad mesh was adopted in the model which improved the solving efficiency and the meshing. About 40,000 grids were meshed and the time step was set to 0.001 s. The Finite Volume Method (FVM) was used to discrete the governing equations. The geometric reconstruction scheme used a piecewise-linear approach to solve the volume fraction continuity equation. This was the most accurate method and is applicable for general unstructured meshes in FLUENT. To couple the pressure and velocity, the SIMPLE algorithm was introduced. The upwind scheme of the first order was adopted to discrete the momentum and energy equations. When the residual mass, energy and velocity was less than 0.0001, it can be considered that the numerical calculation converges. The simulation test indicated that a good convergence was reached if the under-relaxation factors were used at values: 0.3 (pressure), 1 (density), 1 (body force), 0.7 (momentum), volume fraction (0.2) and 1 (energy).
The primary phase was water and the secondary phase was vapor. The saturation temperature was 373 K. Other properties are shown in Table 1.
Table 1. Properties of liquid and vapor
|
liquid |
Vapor |
||
|
kl |
0.6 |
kv |
0.0261 |
|
Cl |
4182 |
Cv |
2014 |
|
ρl |
998.2 |
ρv |
0.5542 |
|
μl |
0.001 |
μv |
1.34×10⁻⁵ |
|
h |
2.418×10⁸ |
||
4.2 Characteristics analysis of evaporation and condensation
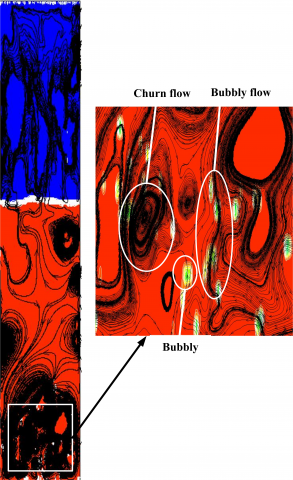
In the evaporation section, the two-phase boiling flow contained bubbly flow, slug flow, churn flow and annular flow which are shown in Figure 4. The bubbles emerged on the heat wall from small to large, which were then forced to move irregularly by the buoyancy force, the surface tension and convection. The conclusion derived from the result of the Isao and Mamoru [38] showed that if the non-dimensional diameter of the model $d_{c}$ is larger than 40, the slug bubble can no longer sustain itself, and the bubbly flow and churn flow can be more common. The Eq(17) can be expressed from the Taylor wavelength theory and the non-dimensional hydrodynamic diameter. In the paper, $d_{c}$ was estimated to be 99 which is much bigger than 40. The numerical results show good agreement with the theory.
$d_{c}=\frac{d}{\sqrt{\sigma / g \Delta \rho}}$(17)
Figure 4. Two-phase distribution in evaporation and condensation
Figure 5. The flow character of Boiling
The churn flow and bubbly flow are shown in Figure 5 which were accompanied by the shape change of the bubbly flow. This is because the shape of bubbly flow was mainly affected by the Reynolds Number and Bond Number under a certain density and viscosity ratio of vapor to liquid. However, the Reynolds Number and Bond Number changed during the bubbly flow rise. At the beginning, the bubbly flow was accelerating, but as the bubbles moved, the deformation of bubbles disturbed the molecule of bubbles which lash the bubble film. When the deformation and incline of circular bubbles occurred, an uneven force was applied on the bubbly upper and lower surface and the bubbly flow began to rise to similar levels as resonance.
During the rising process of bubbles, the steam condensed into small water droplets on the cooling wall. Affected by surface tension and gravity, the small water droplets moved and integrated into larger droplets. When the droplets were large enough, they were affected by gravity, as shown in Figure 6 (a). During the process of falling, the shape of the droplet changed owing to the influence of Reynolds Number and Weber Number. Figure 6 (b) shows the phenomenon whereby the droplets fall on the surface of the liquid. It can be seen that the droplets changed shape to ellipses as they were close to the liquid surface. The reason for this is that the velocity of the droplets reached a maximum when the droplets fell to the liquid surface.
(a)
(b)
Figure 6. The formation process of droplets(a)and the falling droplets(b)
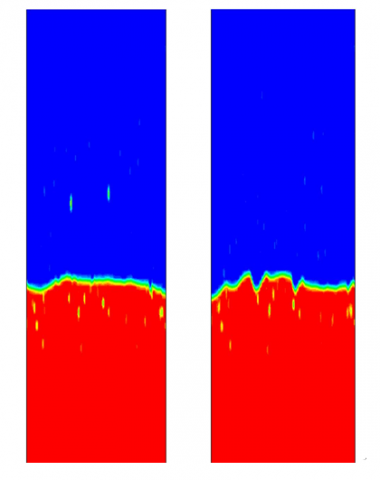
Figure 7 shows the temperature distribution in 1.5s, it can be seen that the greatest temperature difference was up to 24 K. Compared with the liquid and vapor flow in Figure 5, the temperature distribution was closely related to the liquid and vapor flow. That is because the local temperature difference is influenced by local heat transfer coefficient in the bubble motion and the intensity of convection heat transfer determines the temperature distribution. The temperature of the bubbly flow region was 20 K higher than the churn flow region in Figure 7. So it can be considered that the heat transfer coefficient of the bubbly flow is higher than that of the churn flow.
Figure 7. The temperature vectors and contour plots
4.3 The influence of superheat on the evaporation and vapor distribution
Under constant pressure condition,$T_{\mathrm{su}}=T-T_{s a t}$. The relationship of superheat and wall heat flux are shown in Figure 8 (a). There was little wall heat flux difference of initial temperature and this little difference of wall heat flux in the curve was observed until the superheat increased to 20 K. In the process, natural convection was the main heat transfer mode, but the wall heat flux increased rapidly as the superheat increased from 20 - 38 K. At this time, nucleate boiling happened as the wall superheat increased. After reaching 38 K, the wall heat flux decreased as the wall superheat increased. This was all because higher wall superheat is generally associated with larger primary bubbles which causes the liquid to rewet the surface and results in higher wall heat transfer after the bubbles move on the surface or depart.
Under constant pressure conditions, the surface subcooling was $T_{\mathrm{sub}}=T_{\mathrm{sat}}-T$. The bubble departure diameter of the dispersed phase played a key role in the two-phase flow and heat transfer process and has a close relationship with the surface subcooling. Previously, the relationship between the surface subcooling and the bubble departure diameter was obtained from the experimental data [39-42] and empirical formula [43]. In this study, it can be seen from the numerical calculation that bubble departure diameter increased as surface subcooling increased. Bubble departure diameter became larger when it was closer to the fluid downstream in the heating direction.
(a)
(b)
Figure 8. (a) The relationship between superheat and wall heat flux (b) Bubble departure diameter and surface subcooling wall heat flux
(a)
(b)
Figure 9. The relationship between vapor volume fraction and liquid fraction as the distance from heating wall
Figure 9 shows the curves of how the vapor volume fraction and liquid volume fraction changed with the heat wall and cold wall. It is clear that the vapor volume fraction of 0.4 mm was higher than 1 mm in Figure 9(a). The main reason was that the bigger superheat was closer to the heat wall as shown in Figure 9(a). The peak of the curve in Figure 9(b) presents the big droplets during condensation which changed with time. The surface tension of liquid droplets made the droplet fusion increase. When the droplets were big enough, they fell. The droplets emerged in two vertices of the rectangle due to the surface tension and then they moved along the wall.
From the above discussion, although the wall heat flux increased as the wall superheat increased, the wall heat flux decreased as wall superheat increased after a point. When the wall superheat is certain, the initial temperature increased as the wall heat flux increased.
Numerical simulations using VOF model and Finite Volume Method were conducted to investigate the two-phase phenomenon of evaporation and condensation in a closed rectangle. The temperature distribution, bubbly flow and two-phase flow were analyzed and discussed and the relationship between the wall heat flux and superheat was discussed. The following conclusions were obtained. Compared with the churn flow, the heat transfer coefficient of bubbly flow is much higher. Due to the variation of the Reynolds Number and Bond Number during the bubbles rise, the bubbles rise with a movement similar to resonance and they change shape. Higher wall superheat is generally associated with larger primary bubbles which cause the liquid to rewet the surface and result in higher wall heat transfer after the bubbles move on the surface or depart.
The research work described in this paper was supported by the National Science Foundation of China under Grant nos. 51335006 and 51505486.
|
ν |
velocity |
|
S |
Source term |
|
hfg |
latent heat of evaporation (KJ.Kg-1) |
|
d |
Width (m) |
|
ρ |
Density (kg. m-3) |
|
T |
Temperature (K) |
|
t |
Time (s) |
|
c |
heat capacity (j.kg-1.k-1) |
|
k |
Thermal Conductivity (w.m-1.k-1) |
|
p |
Pressure (pa) |
|
L |
Length (m) |
|
μ |
Viscosity (kg.m-1.s-1) |
|
h |
Energy(J) |
|
g |
gravity acceleration (m. s-2) |
|
Fvol |
volumetric force (Pa. m-1) |
|
H |
vaporization enthalpy (J. kg-1) |
|
Greek symbols |
|
|
$\alpha$ |
volume fraction |
|
β |
phase transformation rate (kg. m-3. s-1) |
|
$\delta$ |
Surface tension coefficient |
|
Subscripts |
|
|
v |
vapor |
|
sat |
saturation |
|
su |
superheat |
|
e |
evapor |
|
l |
liquid |
|
sub |
subcooling |
|
vol |
volume |
|
E |
Energy |
[1] Ch. Audy, M. Fischer, E.W. Messerschmid, “Nonsteady behaviour of solar dynamic power systems with Stirling cycle for space stations,” Aerospace Science and Technology, vol. 3, no. 1, pp. 49-58, 1999. DOI: 10.1016/S1270-9638(99)80022-4.
[2] A. Faghri, Heat Pipe Science and Technology, Taylor & Francis, Washington, D.C., 1995, pp. 1–3. DOI: 10.1016/0140-6701(95)95610-H.
[3] Y.W. Kuang, Wen Wang, Rui Zhuan, C.C. Yi, “Simulation of boiling flow in evaporator of separate type heat pipe with low heat flux,” Annals of Nuclear Energy, vol. 75, pp. 158–167, 2015. DOI: 10.1016/j.anucene.2014.08.008.
[4] Taig Young Kim, Bum-Seok Hyun, Jang-Joon Lee, Juhun Rhee, “Numerical study of the spacecraft thermal control hardware combining solid–liquid phase change material and a heat pipe,” Aerospace Science and Technology, vol. 27, no. 1, pp. 10–16, 2013. DOI: 10.1016/j.ast.2012.05.007.
[5] R.V. Rao, K.C. More, “Optimal design of the heat pipe using TLBO (teaching learning-based optimization) algorithm,” Energy, vol. 80, pp. 535-544, 2015. DOI: 10.1016/j.energy.2014.12.008.
[6] Mohsen Goodarzi, Mohammad Mehdi Rashidi, Amir Basiri Parsa, “Analytical and numerical solutions of vapor flow in a flat plate heat pipe,” Walailak Journal of Science and Technology, vol. 9, no. 1: pp. 65-81, 2012. DOI: 10.2004/vol10iss1ppAccepted.
[7] N. Pooyoo, S. Kumar, J. Charoensuk, A. Suksangpanomrung, “Numerical simulation of cylindrical heat pipe considering non-Darcian transport for liquid flow inside wick and mass flow rate at liquid–vapor interface,” International Journal of Heat and Mass Transfer, vol. 70, pp. 965–978, 2014. DOI: 10.1016/j.ijheatmasstransfer.2013.11.023.
[8] Said Bouabdallah, Badia Ghernaout, Mohamed Teggar, Ahmed Benchatti and F-Zohra Benarab, “Onset of natural convection and transition laminar-oscillatory convection flow in Rayleigh-Bénard configuration,” International Journal of Heat and Tecgnology, vol. 34, no. 1, pp. 151-157, March 2016. DOI: 10.18280/ijht.340122.
[9] Z. Yang, X.F. Peng, P. Ye, “Numerical and experimental investigation of two-phase flow during boiling in a coiled tube,” International Journal of Heat and Mass Transfer, vol. 51, no. 5-6, pp. 1003–1016, 2008. DOI: 10.1016/j.ijheatmasstransfer.2007.05.025.
[10] Jungho Kim, John F. Benton, Derek Wisniewski, “Pool boiling heat transfer on small heaters: effect of gravity and subcooling,” International Journal of Heat and Mass Transfer, vol. 45, no 19, pp. 3919–3932, 2002. DOI: 10.1016/S0017-9310(02)00108-4.
[11] Xiaoyuan Wang, Tingting Ma, Yuezhao Zhu, Haijun Chen, Jinling Zeng, “Experimental investigation on startup and thermal performance of a high temperature special-shaped heat pipe coupling the flat plate heat pipe and cylindrical heat pipes,” Experimental Thermal and Fluid Science, vol. 77, pp. 1–9, 2016. DOI: 10.1016/j.expthermflusci.2016.03.013.
[12] Seyed Ehsan Rafiee and M. M. Sadeghiazad, “Heat and mass transfer between cold and hot vortex cores inside Ranque-Hilsch vortex tube-optimization of hot tube length,” International Journal of Heat and Tecgnology, vol. 34, no. 1, pp. 31-38, March 2016, DOI: 10.18280/ijht.340105.
[13] M. F. El-Amin, Jisheng Koub, Shuyu Sun, Amgad Salama, “Numerical modeling of nanoparticles transport with two-phase flow in porous media using iterative implicit method,” Physics, 2013. DOI: 2013arXiv1310.4769E.
[14] D. Z. Guo, D. L. Sun, Z.Y.Li, W. Q. Tao, “Phase change heat transfer simulation for boiling bubbles arising from a vapor film by the VOSET Method,” Numerical Heat Transfer, Part A: Applications, vol. 59, no. 11, pp. 857–881, 2011. DOI: 10.1080/10407782.2011.561079.
[15] Abduljalil A. Al-abidi, Sohif Bin Mat, K. Sopian, M.Y. Sulaiman, Abdulrahman Th. Mohammed, “CFD applications for latent heat thermal energy storage: a review,” Renewable and Sustainable Energy Reviews, vol. 20, pp. 353–363, 2013. DOI: 10.1016/j.rser.2012.11.079.
[16] S.B. Riffat, G. Gan, “Determination of effectiveness ofheat-pipe heat recovery for naturally-ventilated buildings,” Applied Thermal Engineering, vol. 18 no.3, pp.121–130, 1998. DOI: 10.1016/S1359-4311(97)00033-1.
[17] G. Gan, S.B. Riffat, “A numerical study of solar chimney for natural ventilation of buildings with heat recovery,” Applied Thermal Engineering, vol. 18, no. 12, pp. 1171–1187, 1998. DOI: 10.1016/S1359-4311(97)00117-8.
[18] Nourouddin Sharifi, Amir Faghri, Theodore L. Bergman, Charles E. Andraka, “Simulation of heat pipe-assisted latent heat thermal energy storage with simultaneous charging and discharging,” International Journal of Heat and Mass Transfer, vol. 80, pp. 170–179, 2015. DOI: 10.1016/j.ijheatmasstransfer.2014.09.013.
[19] Asghar Alizadehdakhel, Masoud Rahimi, Ammar Abdulaziz Alsairafi, “CFD modeling of flow and heat transfer in a thermosyphon,” International Communications in Heat and Mass Transfer, vol. 37, no. 3, pp. 312–318, 2010. DOI: 10.1016/j.icheatmasstransfer.2009.09.002.
[20] Fadhl B., Wrobel L.C., Jouhara H., “Numerical modeling of the temperature distribution in a two-phase closed thermosyphon,” Applied Thermal Engineering, vol. 60, no. 1-2, pp.122-131, 2013. DOI: 10.1016/j.applthermaleng.2013.06.044.
[21] Kafeel K., Turan A., “Simulation of the response of a thermosyphon under pulsed heat input conditions,” International Journal of Thermal Sciences, vol. 80, pp. 33-40, 2014. DOI: 10.1016/j.ijthermalsci.2014.01.020.
[22] Sun Dongliang, Xu Jinliang, Wang Li, “A vapor-liquid phase change model for two-phase boling and condensation,” Journal of Xi’ An Jiao Tong University, vol. 46, pp.7-11, 2012. DOI: 10.7652/xjtuxb201207002.
[23] Hirt C W, Nichols BD, “Volume of fluid (VOF) method for the dynamics of free boundary,” Journal of Computational Physics, vol. 39, no. 1, pp. 201-225, 1981. DOI: 10.1016/0021-9991(81)90145-5.
[24] C. W. Hirt and B. D. Nichols, “Volume of Fluid (VOF) method for the dynamics of free boundary,” Journal of Computational Physics, vol. 39, no. 1, pp. 201–225, 1981. DOI: 10.1016/0021-9991(81)90145-5.
[25] S. Welch and J. Wilson, “A volume-of-fluid based method for fluid flows with phase change,” Journal of Computational Physics, vol. 160, no. 2, pp. 662–682, 2000. DOI: 10.1006/jcph.2000.6481.
[26] D. L. Youngs, “Time-dependent multi-material flow with large fluid distortion,” Numerical Methods for Fluid Dynamics, Academic Press, 1982, pp. 273–285. DOI: 10.1007/s11433-009-0265-0.
[27] Lee W. H., “A pressure iteration scheme for two-phase flow modeling,” Washington, USA: Hemisphere Publishing, 1980, pp. 37. DOI: 10.1142/9789814460286_0004.
[28] Jensen K.F., “Microreaction engineering-is small better?” Chemical Engineering Science, vol. 56, no. 2, pp. 293-303, 2001. DOI: 10.1016/S0009-2509(00)00230-X.
[29] G. Tryggvason, A. Esmaeeli, N. Al-Rawahi, “Direct numerical simulations of flows with phase change,” Computers and Structures, vol. 83,no. 6, pp. 445–453, 2005. DOI: 10.1016/j.compstruc.2004.05.021.
[30] S.W.J. Welch, J. Wilson, “A volume of fluid based method for fluid flows with phase change,” Journal of Computational Physics, vol. 160, no. 2, pp. 662–682, 2000. DOI: 10.1006/jcph.2000.6481.
[31] A. Esmaeeli, G. Tryggvason, “Computations of film boiling. Part I, Numerical method,” International Journal of Heat and Mass Transfer, vol. 47, no 25, pp. 5451–5461, 2004. DOI: 10.1016/j.ijheatmasstransfer.2004.07.027.
[32] Knudsen M, “The kinetic theory of gases,” London, Methuen Co. Ltd., 1934. DOI: 10.1021/ja01514a075.
[33] Crowe C., Sommerfeld M., Tsuji Y., “Multiphase flows with droplets and particles,” Boston: CRC Press, 1998, pp. 752. DOI: 10.1201/b11103.
[34] Wu H.L., Peng X.F., Ye P., Y. Eric Gong, “Simulation of refrigerant flow boiling in serpentine tubes,” International Journal of Heat and Mass Transfer, vol. 50, no. 5, pp. 1186-1195, 2007. DOI: 10.1016/j.ijheatmasstransfer.2006.10.013.
[35] De Schepper, Sandra C.K., Heynderickx, Geraldine J., Marin, Guy B, “Modeling the evaporation of a hydrocarbon feedstock in the convection section of a steam cracker,” Computers and Chemical Engineering, vol. 33, no. 1, pp. 122-132, 2009. DOI: 10.1016/j.compchemeng.2008.07.013.
[36] Fang C, David M, Rogacs A, Goodson K, “Volume of fluid simulation of boiling two-phase flow in a vapor-venting microchannel,” Frontiers in Heat and Mass Transfer, vol. 1, no. 1, pp. 1-11, 2010. DOI: 10.5098/hmt.v1.1.3002.
[37] M. Reimann and U. Grigull, “Warmeubergang bei freier konvektion und flimsieden imkritischen gebiet von- wasser und kohlendioxid,” Heat and Mass Transfer, vol. 8, no.4, pp. 229–239, 1975. (In German.) DOI: 10.1007/BF01002151.
[38] Isao, K., Mamoru, I., “Drift flux model for large diameter pipe and new correlation for pool void fraction,” International Journal of Heat and Mass Transfer, vol. 30, no. 9, pp. 1927–1939, 1987. DOI: 10.1016/0017-9310(87)90251-1.
[39] O. Zeitoun, M. Shoukri, “Axial void fraction profile in low pressure subcooled flow boiling,” International Journal of Heat and Mass Transfer, vol. 40, no. 4, pp. 869-879, 1997. DOI: 10.1016/0017-9310(96)00164-0.
[40] Zeitoun O., Shoukri M., “Bubble behavior and mean diameter in subcooled flow boiling,” Journal of Heat Transfer, vol. 118, no. 1, pp. 110-116, 1996. DOI: 10.1115/1.2824023.
[41] Hari S., Hassan Y.A., “Improvement of the subcooled boiling model for low-pressure conditions in thermal-hydraulic codes,” Nuclear Engineering and Design, vol. 216, no. 1-3, pp. 139-152, 2002. DOI: 10.1016/S0029-5493(02)00050-X.
[42] Tu J.Y., Yeoh G.H., “On numerical modeling of low-pressure subcooled boiling flows,” International Journal of Heat and Mass Transfer, vol. 45, no. 6, pp. 1197-1209, 2002. DOI: 10.1016/S0017-9310(01)00230-7.
[43] Winterton R.H.S, “Flow boiling: prediction of bubble departure,” International Journal of Heat and Mass Transfer, vol. 27, no. 8, pp. 1422-1424, 1984. DOI: 10.1016/0017-9310(84)90072-3.