OPEN ACCESS
This paper studied adsorption characters of rock (soil) on CO2 at the states of pure CO2 and CO2/N2/CH4 ternary mixed gas. CO2 adsorptive capacity of the rock (soil) decrease with the rise of temperature and decrease gradually till saturation condition, but increase with the rise of pressure. The adsorptive capacity of CO2 falls along with shale, mudstone, sandy soil and sandstone. Moreover, the CO2 adsorptive capacity is higher than that of CH4 and N2 obviously. With pressure rising, the CO2 adsorptive capacity of rock (soil) increase slightly first and then remain steady. The ternary mixed gas tests show that as the CO2 concentration in ternary mixed gas is the same, the mixing ratio of N2 and CH4 has little effect on the CO2 adsorptive capacity. Based on the experimental results and Langmuir adsorption theory, an adsorption model of overlying rock (soil) toward CO2 in coal fire area is put forward and then is used to evaluate the incomplete emission effect of CO2 in Wuda coalfield fire area. The proportion of CO2 adsorbed by the overlying rock (soil) in coalfield fire is 25% in maximum and the emission coefficient of CO2 of Wuda coalfield fire area is ~75%.
Coal fire, Carbon dioxide, Adsorption effect, Rock (soil).
Changes of greenhouse gas (GHG) concentration in the atmosphere affect the global climate and environment at different time scales 1. Atmospheric warming caused by GHG has aroused wide concern in the world. United Nations Climate Change Conferences, which have been held many times in the past years, have set carbon emission reduction as the critical measure of dealing with global warming. Especially since Copenhagen Accord was concluded, it has become the topic for discussion that the participating countries shall try to reduce GHG emission actively. As the contracting party of United Nations Framework Convention on Climate Change, China also has international obligations to reduce GHGs.
Increase of GHG concentration in atmosphere results from the combined action of natural factors and human activities 2, therefore, we not only need to study how to eliminate GHG emission caused by human activities, but also need to study the contributions of natural factors on greenhouse effect, so as to acquire the effect law of GHG on atmospheric system objectively. Large area coal fire resulted from coal spontaneous combustion has become a serious natural disaster and distribute widely in the world, such as China, America, India, Indonesia, and so on. Hazards caused by coal fire also rouse concerns of relevant governments and scholars. China is the country with abundant coal resources in the world, with coal distributing more in the north and less in the south, among which over 80% concentrates in north and northwest 3. In the north and northwest of China, there are most of arid and semi-arid climate and the coal is buried shallow and thick. Moreover, exploitation of coal is in disorder. All of these have intensified spontaneous combustion of coal beds and formed large area coal fire areas. Influences of coal fire in north China on global environment have even caused the concerns of international communities and it has been described as global environmental and ecological disasters which might affect the 21st century significantly 4.
There is no doubt that coal fire could release plenty of GHG; however, it must be noted that the GHG released by coal fire must pass through the overlying rock (soil) system of coal bed as being emitted into the atmosphere. The overlying rock (soil) has adsorption effect on GHG. This means that the GHG generated by coal fire is not discharged to the atmosphere completely, i.e., such process is incomplete emission process. From the view of atmospheric environment protection, the more GHG of coal fire contained by the rock-soil system is , the less the GHG discharged into the atmosphere is. This is favorable for greenhouse effect reduction. The fruits related to coal system adsorbing GHGs (CO2, CH4, etc.) mainly centered in adsorption-descorption of CO2 and CH4 in the field of coal bed gas 5-8. There were also expressions on CO2 adsorbtive capacity of shale (including carbonaceous shale) in some documents 910. Coal-bearing stratum is sedimentary rock which is mainly shale, sandstone, mudstone and limestone 11. GHGs generated by coal fire are mainly CO2 and CH4 1213. The adsorption effect of overlying rock (soil) toward these gases is a gas-solid adsorption process under the condition of high pressure and high temperature. However, there has little literatures on the adsorption effect of such process as well as the differences of GHG adsorption by different sedimentary rocks.
The objectives of our research are to test the adsorptive capacity of the overlying stratums samples (which extract from Wuda coalfield fire area in China) on CO2 for pure CO2 and CO2/N2/CH4 ternary mixed gas at high temperature and high pressure, and to evaluate the influence of the overlying rock (soil) on GHG emission in coalfield fire area.
2.1 Samples
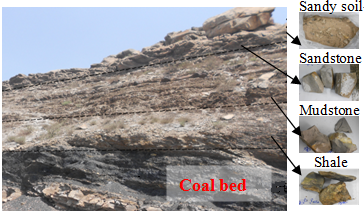
Wuda region locates at ~E39°26′51″, N106°42′46″, 3.5 km away from the Yellow River in the east, 2km away from Wuhushan hill in the west. It is the intersection of Kubuqi, Maowusu and Wulan deserts. Experimental samples are taken from No.3 coalmine of Huayin Company, located in Wuda, Inner Mongolia. The samples are obtained from four stratums (sandy soil, sandstone, mudstone and shale, from surface to coalbed), which are outcrop obviously (See Figure 1). The samples collected in situ are put in sealed containers and taken to the laboratory. Then, they are smashed to particles and are sieved to 60 meshes, which are put into wide mouth bottle for experiment. The sample mass used in each adsorption test is 120 g. The basic parameters of the experimental samples are listed in Table 1.
Table 1. Basic parameters of samples
|
Samples |
Particle size |
Moisture (%) |
|
Shale |
60 |
2.11 |
|
Mudstone |
60 |
1.96 |
|
Sandstone |
60 |
1.24 |
|
Sandy soil |
60 |
2.15 |
Figure 1. Stratum of the sampling site at coal fire area
2.2 Equipment and method
Selection of experimental pressure and temperature. Burning depth in the coalfield fire in north China are range from dozens of meters to over two hundred meters14 -16, but not more than 250m usually. Normal formation pressure gradient is 9.8-10.496 KPa/m 17. Therefore the experimental pressure range is set as 0.5-3.5Mpa with an interval of 1Mpa (namely, there are four pressure equilibrium points, i.e. 0.5Mpa, 1.5Mpa, 2.5Mpa and 3.5Mpa). The research and survey of coal spontaneous combustion in north China 18 showed that temperature of overlying strata ranged from normal to 300oC at different stages of coal fire. Thus, the experimental temperature is selected as 20-300oC. During the experiment, gas analysis is conducted every 20 oC (there are 15 temperature equilibrium points).
Determination of the proportion of absorbed gas. CO2 has the largest proportion in all of GHGs during coal fire burning, followed by CH4 19. Meanwhile, there also exists N2 and other micro gases (such as CO) in the environment of coal fire. Our objective is to investigate the characteristics of overlying rock (soil) adsorbing CO2. Thus, here ignores the influence of micro gases and observes the law of rock (soil) adsorbing CO2 when there exist CH4 and N2. The adsorption experiment is preceded in two steps: (1) isothermal adsorption of pure CO2, N2, and CH4; and (2) adsorption of CO2/N2/CH4 ternary mixed gas. For CO2/N2/CH4 ternary mixed gas adsorption test, the volume proportion of N2, CH4 and CO2 is set as: (1) N2: CH4:CO2=20:20:60; (2) N2: CH4:CO2= 50: 10:40; (3) N2: CH4:CO2= 20:60:20%; (4) N2: CH4:CO2=50:40:10.
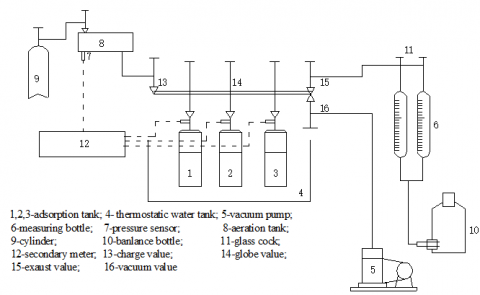
The experimental system is shown in Figure 2. Adsorption experiment is finished by ISO-300 gas adsorption analyzer, made in TerracTek Company of USA. During experiment, open the control valve and the reference cylinder valve, and charge CO2 and other gases into the experimental system; adjust the temperature of the reference cylinder to target temperature. When the temperature reaches the target and remains steady, the adsorption test procedure is started to collect time, pressure, temperature and other relevant data in the sample cylinder and the reference cylinder automatically. And the data are recorded as a file. According to the maturity and the quality of samples, the adsorption equilibrium time is determined as no less than 12 hours.
Figure 2. Gas adsorption analyzer system
3.1 Influence of temperature and pressure on CO2 adsorption
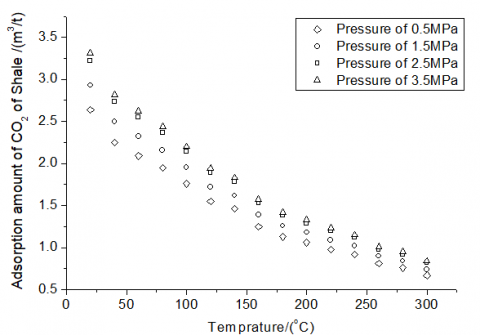
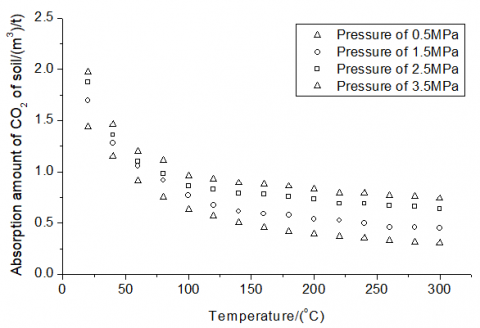
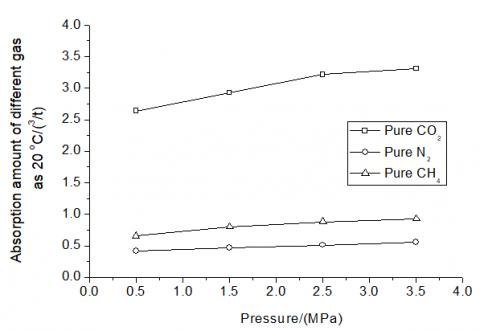
Figure 3 is the statistics of the adsorptive amount of samples on pure CO2 at different pressures and temperatures. It showes that the CO2 adsorptive capacity decrease with the rise of temperature and gradually reaches adsorption saturation. The adsorption of rock (soil) on CO2 mainly is physical adsorption and an exothermic process. Thus, the CO2 adsorptive capacity of the samples at low temperature is much stronger. With the increase of pressure, CO2 adsorptive amount of rock (soil) increases gradually. The basic law of the adsorption of rock (soil) toward CO2 with temperature and pressure is similar to the relevant research results 20.
Figure 3. Adsorption of different samples on pure CO2 (standard state)
For the same temperature and the pressure, the adsorptive amount of shale is larger than that of mudstone; the adsorptive amount of mudstone is larger than that of sandy soil, while the adsorptive amount of sandstone is the weakest. This character resultes from different maturity and porosity of the samples 21. The formation order of the sampling stratum in Wuda coalfield is shale, mudstone and sandstone. There exists stronger biomass and microbiological effects in sandy soil. Thus, besides the soil, the CO2 adsorptive amounts of different samples are consistent with the formation time of the stratum, i.e. the closer to the coal bed is, the more CO2 adsorptive capacity is.
Figure 4 is the comparison of adsorptive amounts of shale on pure CO2, pure N2 and pure CH4. It showes that the adsorption quantity of rock on the three pure gases is CO2>CH4>N2 and the adsorptive capacity of samples on CO2 is significantly higher than that of CH4 and N2. Yi, et al 22, Zhang 23, et al. also obtained similar conclusion in tests of activated carbon and coal adsorbing CO2, N2 and CH4. The critical temperatures of CO2, CH4 and N2 are 31oC, -83oC and -147oC respectively. For the same temperature and pressure, the lower critical temperature of the gas is, the more difficult for solid adsorbing the gas is 24. Our research also showes that CO2 has obvious adsorption competitive advantage than N2 and CH4. The lower the temperature is, the more obvious the advantage is. However, with the increase of pressure, the adsorption advantage of CO2 increases slightly first and then retaines steady.
Figure 4. Adsorptive amount of shale on pure CO2, N2 and CH4 (standard state)
3.2 Influence of CH4/N2 on CO2 adsorption
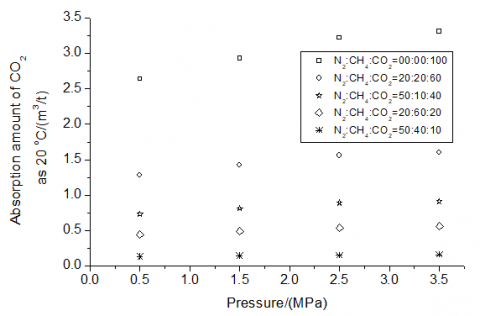
In the ternary mixed gas experiment of GHGs, the shape of CO2 adsorption curve is similar to that of pure CO2 (see figure 5). The tendency of CO2 adsorption with the changes of temperature and pressure is the same with that during pure CO2 experiment. The adsorptive capacity of CO2 decreases with the rise of the temperature and increases with the increase of the pressure. During the temary tests, the higher the CO2 proportion is, the larger the CO2 adsorption is. When the content of CO2 decreases, the CO2 adsorption curve is far away from the adsorption curve of pure CO2.
Table 2 is the CO2 adsorption quantity of shale at different mixed proportions of gases. It showes that for a fixed ratio of CO2 in the mixed gas, the CO2 adsorption with higher proportion of CH4 is slightly lower than that with the higher proportion of N2. Compared with CH4, the competitive advantage of CO2 to N2 is larger than that of CO2 to CH4. Therefore, if the content of CH4 is lower and the content of N2 is higher, the adsorptive amount of CO2 increases slightly. It’s noted that the CO2 adsorption quantity is determined not only by its adsorptive advantage, but also by the proportions of the gases mixed. Table 2 showes that with the increase of temperature and pressure, the difference of CO2 adsorptive amount of two tests (N2:CH4:CO2=20:60:20 and N2:CH4:CO2=70:10:20) remaines 0.01-0.04 m3/t, with average difference of ~0.028 m3/t. In these two tests, the proportion of (N2+CH4) is 80% and that of CO2 is 20%. Therefore, we can determine that if the proportion of CO2 keeps invariant in ternary mixed gas, the proportion change of N2 and CH4 has little influence on the adsorptive amount of CO2.
Figure 5. Adsorption amount of CO2 in ternary mixed gas experiment (shale, standard state)
Table 2. CO2 adsorptive amount of shale (standard state, m3/t)
|
Temperature/ oC |
N2:CH4:CO2=20:60:20 |
N2:CH4:CO2=70:10:20 |
||||||
|
0.5MPa |
1.5MPa |
2.5MPa |
3.5MPa |
0.5MPa |
1.5MPa |
2.5MPa |
3.5MPa |
|
|
20 |
0.44 |
0.49 |
0.54 |
0.56 |
0.44 |
0.49 |
0.54 |
0.57 |
|
40 |
0.39 |
0.43 |
0.47 |
0.48 |
0.4 |
0.45 |
0.49 |
0.51 |
|
60 |
0.34 |
0.37 |
0.41 |
0.42 |
0.36 |
0.4 |
0.43 |
0.44 |
|
80 |
0.29 |
0.32 |
0.35 |
0.36 |
0.31 |
0.36 |
0.39 |
0.39 |
|
100 |
0.25 |
0.27 |
0.3 |
0.31 |
0.28 |
0.31 |
0.34 |
0.35 |
|
120 |
0.21 |
0.23 |
0.25 |
0.26 |
0.25 |
0.27 |
0.3 |
0.3 |
|
140 |
0.2 |
0.22 |
0.24 |
0.25 |
0.22 |
0.26 |
0.29 |
0.27 |
|
160 |
0.18 |
0.2 |
0.22 |
0.23 |
0.2 |
0.24 |
0.25 |
0.25 |
|
180 |
0.16 |
0.18 |
0.19 |
0.2 |
0.19 |
0.21 |
0.22 |
0.22 |
|
200 |
0.15 |
0.16 |
0.18 |
0.18 |
0.18 |
0.18 |
0.21 |
0.21 |
|
220 |
0.12 |
0.13 |
0.14 |
0.15 |
0.16 |
0.17 |
0.18 |
0.18 |
|
240 |
0.1 |
0.12 |
0.13 |
0.13 |
0.14 |
0.15 |
0.17 |
0.17 |
|
260 |
0.08 |
0.09 |
0.1 |
0.1 |
0.11 |
0.12 |
0.14 |
0.12 |
|
280 |
0.08 |
0.09 |
0.1 |
0.1 |
0.11 |
0.11 |
0.14 |
0.11 |
|
300 |
0.06 |
0.06 |
0.07 |
0.07 |
0.08 |
0.08 |
0.1 |
0.09 |
4.1 CO2 adsorption equation
During the process of coal fire developing, the adsorption of rock (soil) on burning products (CO2, CH4, N2, etc.) belongs to gas-solid adsorption issue, which has the most commonly applied theory - Langmuir adsorption theory. According to Langmuir theory, the adsorption equation of rock (soil) on single component gas 25 can be described as follows
$V=V_{L} \cdot \frac{P}{P_{L}+P}$ (1)
Where V is the adsorptive capacity, m3/t; P is the adsorption pressure, MPa; VL is Langmuir volume coefficient; PL is Langmuir pressure coefficient.
The experimental results of coal fire in situ and in laboratory 1213 show that CO2 had the largest proportion in the GHGs produced by coal fire, followed by CH4, while N2 has the largest proportion among all the gas components. Our experimental results conclud that CH4 and N2 reduce the quantity of CO2 adsorbed by the overlying strata because of the adsorption competition. Thus, Langmuir single component adsorption equation do not suitable for predicting the adsorption effect of the overlying rock (soil) on CO2 directly. Extended Langmuir model retains all the consumed conditions of traditional Langmuir adsorption theory and considers that each component will conduct competitive adsorption at each active center. Therefore, here adopts the extended Langmuir model to investigate the adsorptive capacity of rock (soil) on CO2 when there exist CH4 and N2. The adsorption model based on extended Langmuir equation is
$V_{i}=\frac{V_{L i} b_{i} P_{i}}{1+\sum_{i=1}^{n} b_{i} P_{i}}$ (2)
Where Vi is the adsorptive capacity of component i, m3/t; VLi is Langmuir volume coefficient of component i;bi is Langmuir adsorption coefficient of component i, equals the reciprocal of Langmuir pressure coefficient, 1/PLi; Pi is the partial pressure of component i, MPa.
According to law of partial pressure, in the mixed gas, the partial pressure (Pi) of component i equals to the total pressure multiplied by the volume fraction (or mole fraction) of component i. Then, based on Eq. (2), the equation of calculating CO2 adsorptive capacity of the overlying rock (soil) in the coal fire area is
$V_{C O 2}=\frac{V_{L, C O_{2}} y_{C O_{2}} P / P_{L, C O_{2}}}{1+\frac{y_{C O_{2}} P}{P_{L, C O_{2}}}+\frac{y_{C H_{4}} P}{P_{L, C H_{4}}}+\frac{y_{N_{2}} P}{P_{L, N_{2}}}}$ (3)
Where VCO2 is CO2 adsorptive capacity at multi-components, m3/t; VL,CO2 is Langmuir volume coefficient of pure CO2; PL,CO2, PL,CH4, PL,N2 are Langmuir pressure coefficient of pure CO2, pure CH4 and pure N2; P is total pressure, MPa; yCO2, yCH4, yN2 are the volume fraction of CO2, CH4 and N2 in the mixed gas.
It is needed to be explained that VL and PL in Eq. (3) have definite physical meanings. VL represents the volume coefficient, and the smaller it’s fitting value, the less the gas saturation adsorption capacity. PL stands for the pressure coefficient, whose value relates with gas adsorption heat. The larger the PL value, the smoother the isothermal adsorption curve of the gas. However, if achieving the real physical meanings of VL and PL, the pressure adopted in the adsorption test should reach a rather large range. It needs change from very low range of Henry’s Law to the adsorption limit pressure of the gas. The pressure doesn’t reach the state of adsorption saturated pressure in our study, for this reason, it is unnecessary to emphasize the physical meanings here. VL and PL are regarded as empirical constants merely.
According to the experimental data and Eq. (1), we regress the adsorptive capacity of pure CO2, pure CH4 and pure N2 at different temperatures to acquire the VL and PL of single component (see Table 3). It showes that the fitting results are high correlation with the experimental results (R2 were above 0.98). From Table 3, it can be seen that PL around one certain constant with a small variation range with the rise of the temperature, while CL decreases. Therefore, we apply nonlinear fitting to obtain the computational equation of CL and regard PL as a constant. The expression of CL and the mean value of PL regressed from the experimental results are all listed in Table 4. According to Table 4, the expression of VL fitted from the four samples can be expressed as
$V_{L}=a_{1} \ln t+a_{2}$ (4)
Where a1 and a2 are the two coefficients in fitted equation of VL in Table 4.
Taking Eq. (4) into Eq. (3), the volume quantity of CO2 absorbed by unit mass rock (soil) at standard state is
$V_{C O 2}=\frac{\left(a_{1} \ln (t)+a_{2}\right) \cdot y_{C O_{2}} \cdot P / P_{L, C O_{2}}}{1+\frac{y_{C O_{2}} P}{P_{L, C O_{2}}}+\frac{y_{C H_{4}} P}{P_{L, C H_{4}}}+\frac{y_{N_{2}} P}{P_{L, N_{2}}}}$ (5)
Table 3. VL and PL of the shale
|
Temperature/oC |
VL,CO2 |
PL,CO2 |
R2 |
VL,CH4 |
PL,CH4 |
R2 |
VL,N2 |
PL,N2 |
R2 |
|
20 |
3.3790 |
0.1500 |
0.9951 |
0.9708 |
0.2494 |
0.9959 |
0.5587 |
0.1820 |
0.9878 |
|
40 |
2.8778 |
0.1493 |
0.9952 |
0.8605 |
0.2544 |
0.9968 |
0.4679 |
0.1643 |
0.9894 |
|
60 |
2.6753 |
0.1500 |
0.9952 |
0.7516 |
0.2505 |
0.9961 |
0.4295 |
0.1682 |
0.9871 |
|
80 |
2.4873 |
0.1478 |
0.9961 |
0.7013 |
0.2581 |
0.9968 |
0.3887 |
0.1635 |
0.9888 |
|
100 |
2.2441 |
0.1474 |
0.9952 |
0.6413 |
0.2574 |
0.9973 |
0.3597 |
0.1844 |
0.9869 |
|
120 |
1.9814 |
0.1490 |
0.9953 |
0.5828 |
0.2432 |
0.9952 |
0.3096 |
0.1622 |
0.9871 |
|
140 |
1.8678 |
0.1497 |
0.9951 |
0.5451 |
0.2745 |
0.9947 |
0.2834 |
0.1888 |
0.9925 |
|
160 |
1.6051 |
0.1521 |
0.9952 |
0.5065 |
0.2552 |
0.9979 |
0.2738 |
0.1995 |
0.9920 |
|
180 |
1.4509 |
0.1517 |
0.9956 |
0.4385 |
0.2457 |
0.9952 |
0.2398 |
0.1844 |
0.9869 |
|
200 |
1.3569 |
0.1497 |
0.9956 |
0.4196 |
0.2660 |
0.9949 |
0.1990 |
0.1778 |
0.9887 |
|
220 |
1.2582 |
0.1519 |
0.9952 |
0.3541 |
0.2533 |
0.9949 |
0.1797 |
0.2095 |
0.9862 |
|
240 |
1.1740 |
0.1478 |
0.9953 |
0.3321 |
0.2322 |
0.9970 |
0.1491 |
0.1332 |
0.9915 |
|
260 |
1.0295 |
0.1445 |
0.9960 |
0.2872 |
0.2625 |
0.9992 |
0.1393 |
0.1468 |
0.9903 |
|
280 |
0.9664 |
0.1458 |
0.9950 |
0.2601 |
0.2421 |
0.9914 |
0.1296 |
0.1635 |
0.9888 |
|
300 |
0.8579 |
0.1511 |
0.9943 |
0.2192 |
0.2457 |
0.9952 |
0.1199 |
0.1844 |
0.9869 |
Table 4. CL,CO2 expressions and mean value of PL to pure gas adsorption
|
Samples |
VL,CO2 |
PL |
|||
|
Fitted equation(t is temperature) |
R2 |
PL,CO2 |
PL,CH4 |
PL,N2 |
|
|
Shale |
VL,CO2= -0.974ln(t) + 6.5418 |
0.9727 |
0.15 |
0.253 |
0.174 |
|
Mudstone |
VL,CO2= -0.533ln(t) + 3.6588 |
0.9795 |
0.15 |
0.088 |
0.091 |
|
Sandstone |
VL,CO2= -0.323ln(t) + 2.2663 |
0.9872 |
0.18 |
0.144 |
0.39 |
|
Sandy soil |
VL,CO2= -0.595ln(t) + 3.7395 |
0.9625 |
0.146 |
0.166 |
0.457 |
Table 5. Comparison of predicted value and experimental value of CO2 (CO2:CH4:N2=40:10:50, shale)
|
Temperature /oC |
P=0.5MPa |
P=1.5MPa |
P=2.5MPa |
P=3.5MPa |
||||||||
|
Predicted value |
Experimental value |
Error |
Predicted value |
Experimental value |
Error |
Predicted value |
Experimental value |
Error |
Predicted value |
Predicted value |
Error |
|
|
20 |
0.89 |
0.83 |
0.01 |
0.94 |
0.81 |
0.15 |
0.99 |
0.89 |
0.11 |
1.0 |
0.91 |
0.09 |
|
40 |
0.73 |
0.65 |
0.12 |
0.77 |
0.73 |
0.05 |
0.87 |
0.80 |
0.09 |
0.9 |
0.85 |
0.06 |
|
60 |
0.68 |
0.61 |
0.11 |
0.71 |
0.67 |
0.07 |
0.8 |
0.74 |
0.05 |
0.87 |
0.76 |
0.14 |
|
80 |
0.63 |
0.56 |
0.13 |
0.67 |
0.62 |
0.07 |
0.72 |
0.68 |
0.06 |
0.81 |
0.73 |
0.1 |
|
100 |
0.60 |
0.51 |
0.18 |
0.64 |
0.57 |
0.12 |
0.70 |
0.63 |
0.11 |
0.68 |
0.64 |
0.06 |
|
120 |
0.50 |
0.45 |
0.11 |
0.52 |
0.50 |
0.04 |
0.62 |
0.55 |
0.13 |
0.63 |
0.57 |
0.11 |
|
140 |
0.48 |
0.43 |
0.12 |
0.53 |
0.48 |
0.11 |
0.54 |
0.52 |
0.04 |
0.60 |
0.54 |
0.11 |
|
160 |
0.43 |
0.39 |
0.11 |
0.46 |
0.43 |
0.07 |
0.50 |
0.47 |
0.12 |
0.5 |
0.49 |
0.02 |
|
180 |
0.38 |
0.35 |
0.08 |
0.40 |
0.38 |
0.05 |
0.48 |
0.42 |
0.14 |
0.49 |
0.43 |
0.14 |
|
200 |
0.35 |
0.33 |
0.08 |
0.38 |
0.36 |
0.04 |
0.45 |
0.40 |
0.12 |
0.46 |
0.41 |
0.12 |
|
220 |
0.35 |
0.30 |
0.15 |
0.37 |
0.33 |
0.11 |
0.39 |
0.36 |
0.08 |
0.4 |
0.38 |
0.1 |
|
240 |
0.27 |
0.28 |
-0.03 |
0.28 |
0.32 |
-0.13 |
0.33 |
0.35 |
-0.06 |
0.34 |
0.36 |
-0.07 |
|
260 |
0.25 |
0.27 |
-0.06 |
0.27 |
0.30 |
-0.11 |
0.31 |
0.33 |
-0.05 |
0.32 |
0.34 |
-0.06 |
|
280 |
0.25 |
0.26 |
-0.05 |
0.26 |
0.29 |
-0.11 |
0.31 |
0.31 |
0.00 |
0.31 |
0.32 |
-0.02 |
|
300 |
0.22 |
0.24 |
-0.06 |
0.24 |
0.27 |
-0.12 |
0.28 |
0.30 |
-0.05 |
0.29 |
0.31 |
-0.06 |
In order to observe the accuracy of Eq. (5), here selects the predicted value of CO2 absorbed by rock (soil) to compare with the experimental value at CO2:CH4:N2= 40:10:50 (see Table 5). The results show that the predicted value of CO2 as the ternary adsorption are very close to the experimental value. These mean that the extended Langmuir equation can realize the computation of CO2 adsorption capacity of rock (soil) well.
We regard the earth surface pressure as 0.1MPa and the formation pressure gradient as 9.8KPa/m, then the equilibrium pressure in Eq. (5) can be expressed as P=0.1+0.0098x (x is the depth away from earth surface, m). So the quantity of CO2 adsorbed by single overlying stratum of the coal fire area is
$G_{C O 2}=S \cdot \rho \cdot h \cdot
\int_{x_{1}}^{x_{2}} \frac{1964 \times\left(a_{1} \ln t+a_{2}\right) y_{1}(0.1+0.0098 x) / P_{L, C 02}}{1+\frac{y_{C O 2}(0.1+0.0098 x)}{P_{L, C O 2}}+\frac{y_{C H 4}(0.1+0.0098 x)}{P_{L, C H 4}}+\frac{y_{N 2}(0.1+0.0098 x)}{P_{L, N 2}}} d x
$ (6)
Where G is the mass of CO2 adsorbed by the stratum, g; t is temperature, oC; x is the depth of the stratum away from the earth surface, m; h is tthickness of the stratum, m; S is the projected area of the fire area on the surface, m2; ρ is the density of the rock (soil), g/cm3; 1964 is the coefficient of the volume of CO2 converting into quality, the mole number of 1m3 gas is 22.4Kmol at the standard state, then the quality of 1m3 CO2 at the standard state is 1000/22.4×44=1964g.
4.2 Emission coefficient of CO2
Coal measures of Wuda coalfield is rather steady inclined strata with 23 coal seams (8 seams in Zhiluo formation, i.e 1#, 2#, 3#, 4#, 4l#, 5#, 6#, and 7#, with the total thickness of 16.6 m and the coal bearing ratio of 15.4%; 15 seams in Yan’an formation, i.e. 8#, 9#, 10#, 11#, 12u#, 12#, 13u3#, 13u2#, 13u1#, 13#, 14#, 15#, 16#, 17# and 18#, with the total thickness of 20.7m and the coal bearing ratio of 9.4%). Most of roofs and floors of the coal seam are leveling. In 2012, the area of Wuda coal field fire area was about 239.6 hm2 26. The densities of shale, mudstone, sandstone and sandy soil overlying the coal bed are 2.5g/m3, 2.55 g/cm3, 2.6 g/cm3 and 1.6 g/cm3, respectively. The average thickness of shale, mudstone, sandstone and sandy soil are about 40m, 40m, 20m, and 1m. According to the observation value of surface temperature and coal spontaneous combustion temperature 2728 and the stratum heat transfer coefficient 29 30, the temperatures of shale, mudstone, sandstone and sandy soil strata are about 100 oC, 80 oC, 50 oC and 20 oC. The laboratory test of coal spontaneous combustion showes that the volume concentration of CO2 generated by spontaneous combustion could reach as high as ~15% when coal fire reaches fully developing stage (~800oC 28). Correspondly, the volume concentration of N2 is ~77% and that of CH4 as high as 4%. Besides CO2, N2 and CH4, during coal fire reaction, there also includ other gases, such as O2, CO, etc, which are included in N2 component in our paper. Thus, here selectes CO2:CH4:N2=15:81:4. According to Eq. (6), the CO2 adsorption quantity of the different overlying strata in Wuda fire area are shale with 55606t, mudstone with 16424t, sandstone with 5040t and sandy soil with 12t. Therefore, the total quantity of CO2 adsorbed by the overlying strata is 77082t.
In the 23 coal beds of Wuda coalfield, 1#, 2#, 4#, 6#, 7#, 9#, 10#, 12# has coal fire. Based on the data of thickness of coal beds 31, the average thickness of coal fire existing is 7.06m 32. Based on the data of combustion efficiency of industrial bituminous coal 3334, the average combustion efficiency is estimated as 76.5%. The average density of coal in Wuda fire area is 1.53g/m3 35, while the carbon content is 0.72 and the average coal remaining rate is 60%. And so, the CO2 released by the coal in Wuda coalfield fire scope is calcu1ated as 313617t based on coal complete combustion law. Then, the proportion of CO2 from coal combustion fixed by the overlying rock(soil) is 77082/313617=25% in the maximum. Namely, if we ignore CO2 absorbed by coal beds and underground water, the emission coefficient of CO2 released in Wuda coal field fire area is ~75%.
We design the experimental scheme on CO2 adsorption of rock (soil) in coal fire area and obtain the CO2 adsorption characters of the four samples (shale, mudstone, sandstone and sandy soil) at states of pure CO2, pure N2, pure CH4 and their ternary mixed gas. Based on Langmuir gas-solid adsorption theory and the experimental results, the computational model of CO2 adsorption amount of the overlying rock (soil) in coal fire area is put forward and is used to estimate the CO2 emission coeffient of the Wuda coal field fire area.
This research is supported by the National Science Foundation of China Program (No. 51304211), the Strategic Priority Research Program of the Chinese Academy of Sciences (No. XDA05030200) and Hebei Mining Development and Safety Technology Lab Program (No. 2013kykf02).
1. J. D. Hakun, P. U. Clark, F. He, S. A. Marcott, A. C. Mix, Z. Liu, B. Otto-Bliesner, A. Schmittner and E. Bard, Global Warming Preceded by Increasing Carbon Dioxide Concentrations during the Last Deglaciation, Nature, vol.484, pp. 49-54, 2012. DOI: 10.1038/nature10915.
2. J. T. Houghton, Y. Ding, D. J. Griggs, M. Noguer, P. J. van der Linden, X. Dai, K. Maskell and C. Johnson, Climate Change 2001: The Scientific Basis, Cambridge University Press, Cambridge, 2001.
3. D. Cao, X. Shi, X. Fan, C. Wu, Environmental Effect Analysis of Coalfield Fire, China Mining Magazine, vol.16, pp. 40-42, 2007.
4. Y. Lang, Hg and Greenhouse Gased Emission and Pollution in North China Coal Fire, 7th Proceedings of Environmental Chemistry of China, 2013.
5. H. Yu, L. Zhou, W. Guo, Predictions of The Adsorption Equilibrium of Methane/Carbon Dioxide Binary Gas on Coals Using Langmuir and Ideal Adsorbed Solution Theory under Feed Gas Conditions, International Journal of Coal Geology, vol.73, pp.115-129, 2008. DOI:10.1016/j.coal.2007.03.003.
6. E. Yalcin, S. Durucan, Methane Capacities of Zonguldak Coals and The Factors Affecting Methane Adsorption, Mining Science and Technology, vol.13, pp.215-222, 1991. DOI: 10.1016/0167-9031(91)91346-J.
7. S. Bachu, Carbon Dioxide Storage Capacity in Uneconomic Coal Beds in Alberta, Canada: Methodology, Potential and Site Identification, International Journal of Greenhouse Gas Control, vol.1, pp. 374-385, 2007. DOI: 10.1016/S1750- 5836(07)00070-9.
8. Z. Weishauptová, O. Přibyl, I. Sýkorová, Effect of Bituminous Coal Properties on Carbon Dioxide and Methane High Pressure Sorption, Fuel, vol. 139, pp.115-124, 2015. DOI: 10.1016/j.fuel.2014.08.030.
9. A. Busch, S. Alles, Y. Gensterblum, D. Prinz, D. N. Dewhurst and M. D. Raven, Carbon Dioxide Storage Potential of Shales, International Journal of Greenhouse Gas Control, vol.2, pp. 297-308, 2008. DOI: 10.1016/j.ijggc.2008.03.003.
10. P. Weniger, W. Kalkreuth, A. Busch and B. M. Krooss, High- Pressure Methane and Carbon Dioxide Sorption on Coal and Shale Samples from the ParanÁ Basin, Brazil, International Journal of Coal Geology, vol. 84, pp. 190-205, 2010. DOI: 10.1016/j.coal.2010.08.003.
11. D. Wang and Y. Wang, Coal Geology and Exploration Method, China University of Mining & Technology Press, Xuzhou, 1995.
12. C. Zhang, S. Guo, Y. Guan, B. Kong, J. Wu, J. Li, J. Wei, W. Duan, D. Cai, X. An and L. Kang, The Diffusion Area Simulation of Gases Released by Coal Fire, Journal of China Coal Society, vol. 37, pp.1698-1704, 2012.
13. A. E. Whitehouse and A. A. S. Mulyana, Coal Fires in Indonesia, International Journal of Coal Geology, vol. 59, pp.91-97, 2004. DOI: 10.1016/j.coal.2003.08.010.
14. Q. Zeng, Study on the Thermal Dynamic Characteristics of Combustion System for Coal Fires in Xinjiang Region, Ph.D Thesis, China University of Mining & Technology, Xuzhou, 2012.
15. D. Cao, X. Shi, X. Fan and G.Wang, Study on The Fractures Related with Coalfield Fire Area In Wuda Coalfield, Inner M ongolia, Journal of China Coal Society, vol. 34, pp.1009-1014, 2009.
16. Z. Song and C. Kuenzer, Coal Fires in China over the Last Decade: A Comprehensive Review, International Journal of Coal Geology, vol. 133, pp.72-99, 2014. DOI: 10.1016/j.coal.2014.09.004.
17. L. Wang, Well Control Technology of Underground Operating, Petroleum Industry Press, Beijing, 2007.
18. H. Guan, Coal Field Spontaneous Combustion Enviroment Investigation and Research in North China, China Coal Industry Publishing House, Beijing, 1998.
19. S. Liu, R. Wu, R. Li, Z. Hu and F. Song, Development and Application of a Device for CO2 emission Flux Observation in Coal Spontaneous Combustion Zone, Environmental Pollution and Control, vol. 36, pp.32-42, 2014.
20. P. Baran, J. Cygankiewicz and K. Zarebska, Carbon Dioxide Sorption on Polish Ortholignite Coal in Low And Elevated Pressure, Journal of CO2 Utilization, vol.3-4, pp.44-48, 2013. DOI: 10.1016/j.jcou.2013.09.003.
21. C. Ou, S. Li, M. Yi, P. Guo and L. Sun, Experimental Determination of Adsorption Isotherms of Gases in Three Reservoir Cores, Acta Petrolei Sinica, vol. 23, pp.72-76, 2002.
22. H. Yi, F. Li, P. Ning, X. Tang, J. Peng, Y. Li and H. Deng, Adsorption Separation of CO2, CH4 and N2 on Microwave Activated Carbon, Chemical Engineering Journal, vol. 215- 216, pp.635-642, 2013. DOI: 10.1016/j.cej.2012.11.050.
23. Z. Zhang, G. Liu, X. Zhang and X. Yang, Adsorption- disorption Experiments of CH4 and CO2 with Different Consistency, Journal of China Coal Society, vol. 34, pp. 551- 554, 2009.
24. Y. X. Wang, W. Su, Y. P. Zhou, Adsorptive Separation Properties of Activated Carbons with Different Pore Structures for CO2, CH4, N2 and O2, Chem. Ind. Eng. Prog, vol. 28, pp. 206-209, 2009.
25. R. Heller and M. Zoback, Adsorption of Methane and Carbon Dioxide on Gas Shale and Pure Mineral Samples, Journal of Unconventional Oil and Gas Resources, vol.8, pp.14-24, 2014. DOI: 10.1016/j.juogr.2014.06.001.
26. D. Cao, G. Yang, X. Dou, X. Song and M. Xiao, Calculation of Carbon Emission of Wuda coalfield fires in Inner Mongolia Based on Remote Sensing Technology, Journal of China Coal Society, vol.39, pp. 2489-2494, 2014.
27. S. B. Kroonenberg and X. Zhang, Pleistocene Coal Fires in Northwestern China, Energy for Early Man., One Million Years of Anthropogenic Global Environmental Change, Proceedings of the ARA Symposium at the Royal Netherlands Academy of Art and Sciences (KNAW), pp. 39-44, 1997.
28. J. Zhang, Study of Undergound Coal Fire and Its Prevention in China, China Coal Industry Publishing House, Beijing, 2008.
29. Y. Zhou, L. Gu, L. Li and L. Wu, Study on The Rock Thermal Conductivity Coefficient and Coal Thermal Property, Energy Technology and Management, vol.5, pp.134-143, 2011.
30. N. Qiu, Characters of Thermal Conductivity and Radiogenic Heat Production Rate in Basins of Northwest China, Chinese Journal of Geology, vol.37, pp.196-206, 2002.
31. D. Cao, X. Fan, H. Guan, Geological Models of Spontaneous Combustion in the Wuda Coalfield, Inner Mongolia, China, Review in Engneering Geology, XVIII, pp.23-30, 2007.
32. X. Du, S. Peng, H. Wang, S. Bernardes, G. Yang and Z. Li, Annual Change Detection by ASTER TIR Data and An Estimation of The Annual Coal Loss and CO2 Emission from Coal Seams Spontaneous Combustion, Remote Sensing, vol.7, pp. 319-341, 2015. DOI: 10.3390/rs70100319.
33. Q. Yu, Experimental Research on The Combustion Efficiency of Blended Coal Injection into BF, Baosteel Technology, vol.1, pp. 33-36, 1999.
34. H. Zeng, B. Yao, J. Qiu and Q. Yu, Studies of Combustion and Slagging Characteristics for Blended Coal with Anthracite and Bituminous, Journal of Combustion Science and Technology, vol.2, pp.181-189, 1996.
35. S. Li, R. Zhao and B. Zhang, Practice of Coal Blending for Suhaitu Coal Washing Plant, Coal Cleaning, vol.5, pp.35-37, 2003.