OPEN ACCESS
In-situ monitoring of tunnel lining surface temperature is the basis for deciding the measures, distribution and parameters of freezing-proof. To overcome the deficiencies in timing frequency of the previous monitoring, an automatic recorder is invented to adapt to low temperature environment and record the lining surface temperature of Hongfu tunnel every hour for nearly two years. With the measured data, main results are obtained as follow: annual temperature changes nearly in a sine form; influenced by the air flow inside the tunnel, temperature changes in a similar way at every monitored section inside. Before tunnel breakthrough, the further the section is from the two ends of the tunnel, the higher the average temperature is in the coldest month. And the average temperature of the coldest month is above 0℃ when the distance is over 200m. After tunnel breakthrough, the temperature is below 0℃ inside the tunnel. The measured data is taken as the boundary condition to simulate the temperature of tunnel lining and surrounding rock with finite element method. The simulation results show that: tunnel lining may freeze and thaw many times in a year; the temperature of tunnel lining and surrounding rock close to lining is below 0℃ in the coldest month, and heat transfers into lining from surrounding rock and its maximum heat flux is 36.08w/m2 on the lining s
Tunnel in cold region, Automatic recorder, Freezing and thawing, FEM analysis.
There appears a series of frozen damage like freezing and thawing and icing up when tunnel is built in cold regions. Lining concrete will be degraded after freezing and thawing for many times, and communication signals and durability of the electrical power equipment will be reduced, which will greatly threaten the safety of driving. Lack of knowledge and investment, there was almost no freezing-proof design in the early constructed cold region tunnels in China, which led to serious frozen damage. In the last two decades, China has attached more importance to freezing-proof of cold region tunnels. Temperature fluctuation at 0℃ is considered as one of three necessary conditions of forming frozen damage[1-2]. Thus study of tunnel temperature is the basis of avoiding frozen damage effectively.
During the last quarter century a large number of cold region tunnels have been built in China, such as Fenghuoshan tunnel, Kunlunshan tunnel, Dabanshan tunnel, et al. which are threatened with serious frozen damage at its construction and operation period[3-4]. Chinese researchers have conducted the site test of tunnel temperature from 1980s. There is always no low voltage power supply system at tunnel construction site and common battery can't work normally under low temperature. Limited by the equipment performance, early researches alway focus on the qualitative study of air temperature inside tunnel, which is warmer in winter and colder in summer than air temperature outside pointed out by Nie feng-ming[5]. Simulation on tunnel temperature taking air temperature as boundary conditions is very complex for it involves air flowing state and temperature transfer mode between air and lining surface. Nowadays researchers collect data automatically with advanced sensor and the measured objects have been extended to the temperature of tunnel lining surface even surrounding rock[6]. Chen jian-xun[7] monitored a 100m long tunnel’s air temperature for one and half year, and found out that it annually changes in a sine form. Early in this century, Chinese researchers carried out the monitoring at Fenghuoshan tunnel and Kunlunshan tunnel at an altitude of 4600-4900m for three years[8-9], and they studied the performance of insulating layer. Although researchers have obtained abundant monitoring data, there still exist some disadvantages, such as monitoring frequency is too low to study the temperature change characteristics in short periods.
Based on Hongfu tunnel in Shanxi province, we invented the automatic recorder, which is adopted to low temperature and records data every hour, showed as Fig.1 and Fig.2. We monitored the lining surface temperature continuously from September 2011 to August 2013. With special lithium battery inside, which can work in low temperature, the automatic recorder adopts an automatic wake-up mode in circuit design. In practical work, the system runs according to the set time interval of 1 hour. The test circuit is dormant expect reading record will be powered in a short time (less than 1 second), and the timing circuit is in the monitoring state. A charge can work continuously for 6 months and record up to 32000 data. The measurement accuracy is 0.06℃.
Figure 1. Automatic recorder
Figure 2. Field installation
Hongfu tunnel is located in Hunyuan County of Shanxi Province, with max altitude of about 1600m, length of 2250m and max depth of 92.7m. In roject district the temperature differs a lot from daytime to night, and varies from season to season with its highest in July or August and lowest in January or February. The precipitation concentration period is from July to September with an annual mean of 420-490mm. The tunnel was designed as separated ones with two ways and four lanes, and is about 2250m long and 10.75m wide. The designed speed is 100km per hour. The bi-directional excavation of the tunnel was finished on January 7, 2012. Hongfu tunnel was not open to traffic during the monitoring period. With no insulation layer, surrounding rock can transfer heat with air inside the tunnel through tunnel lining, thus, the measured data can reflect the temperature interaction of surrounding rock and air. Fig.3 is Hongfu tunnel.
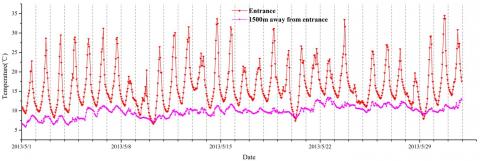
The heat transfer at tunnel ends is influenced by the sunlight radiation, different from which that of the surrounding rock and lining mainly depends on conduction. Thus the characteristics of the temperature change at the entrance and exit differs a lot from that of tunnel inside. Fig.4 shows the measured data of lining surface temperature at the entrance and 1500m away from it in May, 2013. Influenced by the heat convection with air, the maximum and minimum day-temperature appears regularly and generally the min appears during 5-6 a.m., and the max 4-6 p.m. Temperature of the entrance is greatly different from that of inside, for instance, the average temperature of the entrance of May, 2013 is 16.50℃ and average day-temperature difference is 15.73℃. While the average temperature that month of the section 1500m away from it is 9.81℃ and average day-temperature difference is 2.04℃. By the influence of solar radiation, the temperature difference at tunnel ends is always more than 10℃, and there will be more freezing and thawing cycle.
Figure 3. Hongfu tunnel
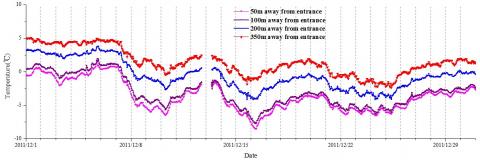
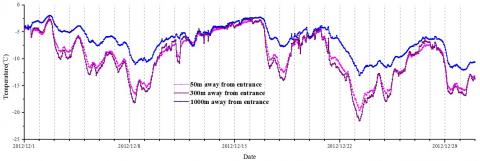
Before the tunnel breakthrough, the temperature of lining surface at the sections 50m, 100m, 200m and 350m away from the entrance in the coldest month of 2011 is showed in Fig.5. It shows temperature at these sections generally changed in the same rhythm, and maximum or minimum temperature appeared nearly at the same time. The further the section is from the entrance, the higher the average temperature is. And the average temperature of these sections was -2.68℃, -1.98℃, 0.33℃ and 2.22℃ respectively in the coldest month. The missing data in Figure 5 was caused during the replacement of the automatic recorders. After the tunnel breakthrough, the temperature of lining surface at the typical sections in the coldest month of 2012 is showed in Fig.6. The rising or lowing of temperature at these sections appeared synchronously. And the temperature of 50m section was quite close to that 300m section with an average temperature of -9.36℃ and -9.71℃ respectively. Temperature of 1000m section was the highest among these three sections with a average temperature of -6.78℃. Temperature of the sections inside the tunnel was below 0℃ all over the month, which means freezing-proof action should be implemented all over the tunnel.
Figure 4. Temperature of lining surface at the entrance and section 1500m away from it in May 2013
Figure 5. Temperature of lining surface at the sections 50m, 100m, 200m and 350m away from the entrance in December 2011
Figure 6. Temperature of lining surface at the sections 50m, 300m and 1000m away from the entrance in December 2012
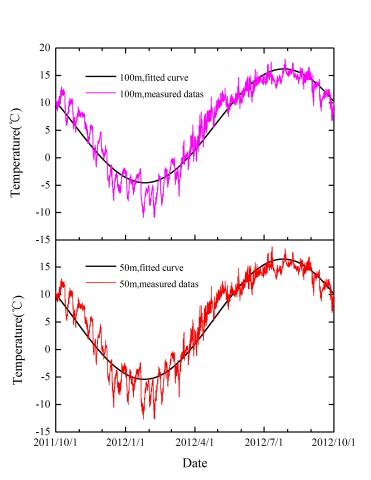
From September 2011 to October 2012, measured temperature data and its fitted curve by sine function as showed in Fig.7 at the two sections 50m orand 100m far from the tunnel entrance. The missing data during the replacement of the automatic recorders was obtained by
linear interpolation. Temperature fluctuation is random in a short period but approaches to sine change yearly. The lowest temperature appeared in February or January; Temperature fluctuation at 0℃ in November, December, March, April, which means the tunnel lining surface temperature will experience freezing and thawing cycle many times in a year. According to relevant research, the second lining elasticity modulus will decreases obviously after 1300 freezing and thawing cycle[10-11].
Fitted temperature of sections of 50m and 100m from the entrance (T50m and T100m) is expressed as formula (1) and (2), in which, time (t) was defined in hours.
$T_{50 m}=5.527631-10.9279 \sin \left(\frac{2 \pi \mathrm{t}}{8784}-0.42860\right)$ (1)
$T_{100 m}=5.831948-10.3750 \sin \left(\frac{2 \pi t}{8784}-0.44041\right)$ (2)
Figure 7. Measured temperature data and its fitted curve by sine function
Due to the lack of adequate monitored data which can be taken as boundary condition directly, sinusoidal function is always taken as boundary conditions in calculation. The monitored data and fitted data are used as boundary conditions for finite element calculation respectively to study the error caused by boundary conditions.
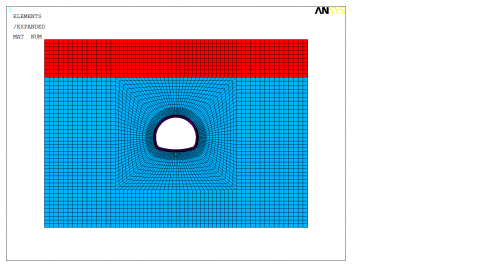
Figure 8. Finite element model
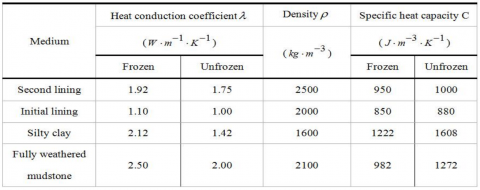
According to the Hongfu tunnel cross-section size a two-dimensional finite element model is established, as showed in Fig.8. The software is ANSYS, and the element PLANE55 is chosen. The time step is one hour, and simulation time is 505 days limited by computer memory. Tunnel depth is 20m and the upper layer is silty clay with 10m thickness while the lower layer is the weathered mudstone. Initial lining thickness is 0.2 meters, and the second lining thickness is 0.5 meters. Due to constructed under ground, the temperature field of tunnel is influenced by groundwater seepage and water-ice transformation. In order to separately analyze the influence of boundary conditions on the results, the calculation did not take groundwater seepage and water-ice transformation into account. The thermal parameters of mediums are shown in Table 1. When the temperature is above 0.5℃, medium parameters are valued according to the unfrozen state, and below -0.5℃, according to the frozen state; If between, according to linear interpolation.
Table 1. Calculating Parameters
Without heat source the control equation can be expressed as formula (3).
$\rho C \frac{\partial T}{\partial t}=\nabla \cdot(k \nabla T)$ (3)
Boundary condition and initial condition will influence the simulation results. The temperature of the section 50m from the entrance is little affected by the excavation regardless of its completion. So the measured data of this section is chosen as boundary condition. According to the present researches of ground temperature, the temperature amplitude of the foundation varies with its depth, but the annual average temperature is nearly the same. The results of temperature monitored in Qinghai Tibet Plateau show that the annual average temperature difference in depth of 0.5m~6.5m is no more than 0.1℃, and the annual temperature fluctuation range in depth of 6.5m is less than 1℃. Thus, the initial temperature is taken the annual average temperature of the section 50m from the entrance, which is expressed as formula (4). At the lining surface and ground surface, the monitored or fitted data at the 50m section is taken as boundary conditions. The bottom boundary remains constant, and other boundary is insulated, showed as formula (5).
$\left.T(t, x, y)\right|_{t=0}=5.53$ (4)
$\frac{\partial T}{\partial x}=0$ (5)
At the interface of medium i and medium j, the temperature satisfies the formula (6), in which n indicates the normal vector of interface.
$\left\{\begin{array}{c}T_{i}=T_{j} \\ n \cdot\left(k_{i} \nabla T_{i}\right)=n \cdot\left(k_{j} \nabla T_{j}\right)\end{array}\right.$ (6)
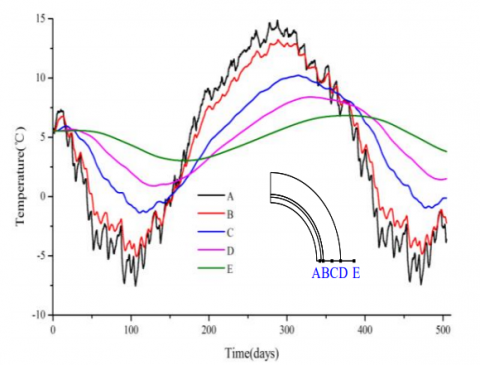
Five nodes in lining and surrounding rock near the tunnel arch springing are selected, and their calculation results are showed in Fig.9 and Fig.10. The nodes temperature in Fig.9 changed smoothly, and the heat conduction caused these nodes to reach the maximum temperature or lowest temperature at delayed time. The nodes A and B experience freezing and thawing one time in a year. In Fig. 9 the nodes A and B fluctuation changes affected by the lining surface temperature, then there may experience freezing and thawing circles more than one time. Temperature curves of nodes C, D, and E are smooth, which is similar to that in Fig.10.
Figure 9. Typical nodels temperature boundaried with measured data
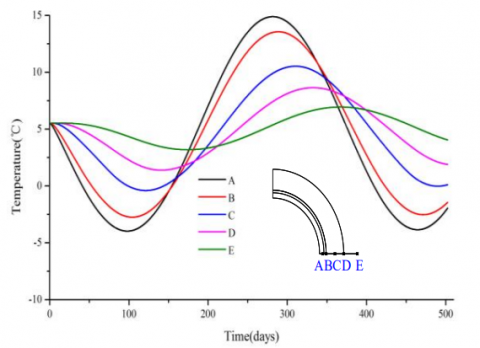
Figure 10. Typical nodels temperature boundaried with sine fitted data
Some scholars define the cold region tunnel with its average temperature at initial lining back in the coldest month below -3℃. According to calculation results shows in Fig.9, the average temperature of point B in coldest month is -4.10℃. While it is -2.65℃ if it takes fitted data as boundary condition in Fig. 10, which means it would not be that accurate in estimating whether it is a cold region tunnel.
In addition to optimizing the tunnel drainage system and structure, there are two methods for tunnel freeze-proof: heat supply and setting up heat insulation layer, and the later one is widely used although it will prevent heat from transferring from the surrounding rock in summer. Heat supply is to transfer the extra energy through different ways to tunnel air, lining, road or surrounding rock, so that their temperature are higher than the frozen point. Heat supply methods include comprehensive heating, electric heating at lining back and tunneling lining ground heat exchangers.
Comprehensive heating freeze-proof refers to transferring the hot water or steam to heat the tunnel. This method is applied to the short tunnels in urban or suburban areas, in which heating conditions need be satisfied. There are some tunnels in the Soviet Union through the installation of heating for freeze-proof, and China's Gansu Qidaoliang tunnel also has been installed heating. Electric heating from the backing is a new method for freeze-proof and it has been applied in Xinjiaodong tunnel. A U-shaped electric belt set up behind tunnel lining. The upper end of the U type electric heating system is connected with the tunnel power supply system, and the end is extended to the longitudinal drain pipe. Electric heating to melt ice is conducted when needed in tunnel operation. As the heating system is set in the interlayer between second lining and initial lining, it can greatly reduce the heating energy consumption. The tunnel lining ground heat exchange system is to heat the tunnel ends with heat source in the surrounding rock in the middle portion.
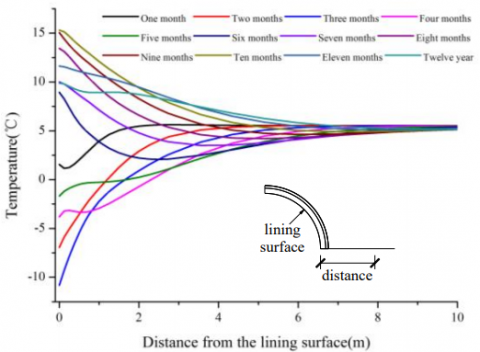
The temperature of tunnel lining arch springing and surrounding rock nearby in different months is shown in Fig.11. Thickness of the freezing circle is about 1.5m, which will disabled tunneling lining ground heat exchangers. While the initial temperature of the surrounding rock is about 5.53℃ in a unfrozen state, there is no influence on tunnel structure if the heat of surrounding rock is prevent from transferring into tunnel inside in summer. Thus setting up heat insulation layer on the second lining surface is effective in freeze-proof.
Figure 11. Temperature of tunnel lining arch springing and surrounding rock nearby at different time
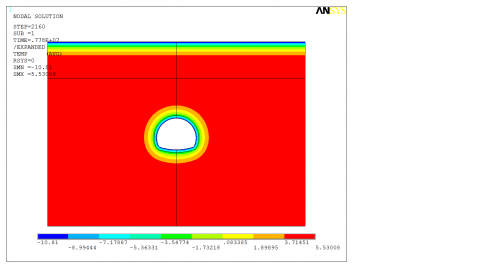
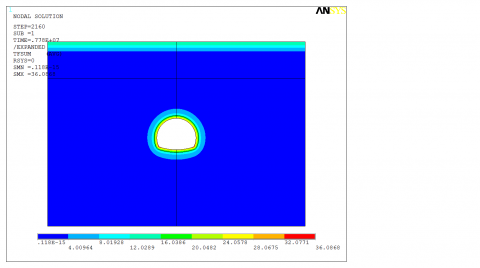
To decide the thickness of heat insulation layer, the temperature and heat flux of tunnel in coldest month is studied and showed in Fig.12 and Fig.13. It can be seen that the temperature isotherm near ground surface is layered horizontally, and the tunnel isotherm is roughly circular. The heat flux density of the ground surface is about 12w/m2, while that of the lining surface is 36.08w/m2. And heat transfers from the surrounding rock into air.
Figure 12. Temperature in the coldest month
Figure 13. Heat flux in the coldest month
Lining surface temperature was measured continuously in a long time with automatic recorders. The measured data was adopted to study the change characteristics of the temperature on lining surface before and after the breakthrough in short or long cycle. Freeze-proof solutions are obtained by simulating the temperature of lining and surrounding rock with measured data as its boundary condition. Other tunnels will be monitored to verify the conclusions of this study.
This paper is financially supported by Natural Science Foundation of China (Grant No.51008308 and Grant No.51478473) and Communication Scientific and Technical Project of Shanxi Province, China (Grant No.10-2-21).
1. Chen Ren-sheng, Kang Er-si, Ji Xi-bin, Yang Jian-ping, Yang Yong. Cold Regions in China, Cold Regions Science and Technology. 2006, 45(2): 95-102.
2. Lai Yuanming, Wu Ziwang, Zhang Shujuan. Study of methods to control frost action in cold regions tunnels[J]. Journal of cold regions engineering, 2003, 17(4):144-152.
3. Shuangyang Li, Yuanming Lai, Wansheng Pei, et al. Moisture–temperature changes and freeze–thaw hazards on a canal in seasonally frozen regions[J]. Natural Hazards, 2014, 72(2): 287-308.
4. Xianjun Tan, Weizhong Chen, Diansen Yang, et al. Study on the influence of airflow on the temperature of the surrounding rock in a cold region tunnel and its application to insulation layer design[J]. Applied Thermal Engineering, 2014, 67(1): 320-334.
5. Nie Feng-ming. Dynamic State of Air Temperature in Railway Tunnels in Cold Regions, Journal of Glaciology and Geocryology, 1988, 10(4): 450-453. (In Chinese).
6. Lai Jin-xing, Xie Yongli, Li Qun-shan. In-Situ Test and Analysis of fhe Ground Temperature Field in Qingshashan Highway Tunnel, ChinaI Railway Science, 2007, 28(5): 78-82. (In Chinese).
7. Chen Jian-xun, Luo Yan-bin. Changing rules of temperature field for tunnel in cold area. Journal of Traffic and Transportation Engineering, 2008, 8(2): 44-48. (In Chinese).
8. Zhang Dehua, Wang Mengshu, Ren Shaoqiang. Experimental study on temperature and response of seasonal active layer of tunnels surrounding rock in permafrost region on Qinghai-Tibet plateau[J]. Journal of Rock Mechanics and Engineering, 2007, 26(3): 614-619. (In Chinese).
9. Zhang Y., He Shusheng, Li Jingbo. Analytic solutions for the temperature fields of a circular tunnel with insulation layer in cold region[J]. Journal of glaciology and geocryology, 2009, 31(1): 114-118. (In Chinese).
10. Mainali G., Dineva S., Nordlund E. Experimental study on debonding of shotcrete with acoustic emission during freezing and thawing cycle[J]. Cold Regions Science and Technology, 2015, 111: 1-12.
11. Qingli Dai, Kenny Ng, Yan Liu, et al. Investigation of internal frost damage in concrete with thermodynamic analysis, microdamage modeling, and time-domain reflectometry sensor measurements[J]. Journal of Materials in Civil Engineering, 2012, 25(9): 1248-1259.