Noor Suhaiza Sauti* | Mohd Effendi Daud | Masiri Kaamin | Suhaila Sahat
© 2021 IIETA. This article is published by IIETA and is licensed under the CC BY 4.0 license (http://creativecommons.org/licenses/by/4.0/).
OPEN ACCESS
This research was conducted with a view to updating the management of earthquakes through an exposure vulnerability and potential seismic risk assessment, along with its application in Sabah (a state in East Malaysia). A set of indicators and methodologies has been proposed in this study with the goal of evaluating the level of exposure vulnerability and potential risk of certain locations to earthquake events at the local district scale. This study specifically involves the development of exposure vulnerability indicators; the statistical analysis method to standardize multivariate data together with a weight calculation of indicator variables; and a mathematical combination of different indicators for the development of the index map using the spatial analysis function of Geographical Information System (GIS) tools. Then, the derived exposure vulnerability index (EVI) map is overlaid with the seismic hazard in determining the geographical location of the most vulnerable areas and their exposure to seismic hazard events. As a result, and based on the available data, the exposure vulnerability index map shows that most districts in Sabah are at relatively low and moderate levels of risk except for a few districts, with several major cities in Sabah, such as Kota Kinabalu, Penampang, Sandakan and Tawau municipality, being situated at a high or very high exposure index. The combination of EVI maps and hazard maps indicate the dominance of the two factors influencing the potential level of earthquake risk. Studies reveal most of the southwest and central parts of the region are not at risk, as both exposure and hazard factors are at a low level. The proposed approach depicts an instrument for identifying cost-effective risk reduction initiatives by providing a scientific method for regional risk planning and management strategies. This research represents the first attempt to evaluate Sabah’s vulnerability to this type of natural disaster by understanding the spatial relationship between exposure vulnerability and earthquake hazard, which undoubtedly could be improved in several aspects.
exposure, vulnerability, GIS modeling, seismic risk, indicators
In the past decade, uncontrolled development, rapid population growth and unmonitored infrastructure development have led to an ever-increasing number of people being exposed to natural disasters. A natural hazard could only become a disaster if it has a negative impact on the exposed and vulnerable human population [1]. Multiple groups have expressed different views on vulnerability by presenting several different definitions and conceptual frameworks according to their respective understanding [2-5]. Vulnerability is commonly referred to as the characteristics defined by social, economic, physical, and environmental influences or processes influencing the rate of destruction caused by earthquakes against the vulnerability of individuals, populations, properties, or structures [6-10]. In other words, vulnerability considers the elements at risk as referring to population and property (exposure); the resilience level of the elements at risk based on the ability to anticipate, adapt and recover effectively when such events occur; and the coping capacity or resistance measures that require the ability of the community to apply the available skills and resources through continuous preparedness, resources stock and effective management in every phase of a disruptive event.
Implementation of earthquake disaster management in Malaysia (including Sabah) is still in its early stage [11] and there is an absence of research on seismic risks assessment [12]. The seismic risk assessment refers to the seismic hazard, vulnerability and response capacity assessment of an area against earthquake threats depending on the location, magnitude and intensity of an earthquake when it occurs. The impediment for developing countries such as Malaysia when implementing seismic vulnerability assessments is the lack of comprehensive data [13-16]. Most of the data required in assessing population and property vulnerability during disasters is the crucial statistical information from the census. This data rarely includes information on the buildings inventory or detailed social demographics, and is also usually presented at a geographical aggregation level that would cause difficulties for its efficient use in risk evaluation. Moreover, there would be constraining issues relating to access to the data given its proprietary nature, confidentiality, reliability, consistency and lack of data transparency [17]. However, in recent years, various research has been conducted by local authorities and researchers to decrease seismic risks focusing on vulnerability assessment in Malaysia [12, 13, 18-21].
Vulnerability varies significantly within a community and over time [22]. In this context, the level of vulnerability of an area is defined as the outcome of an assessment of the index of exposure to natural hazards, as represented by data relating to population and infrastructure for the districts in Sabah. Exposure is the important element of risk in vulnerability that defines the extent of societies and properties which should be evaluated within the geographical context of a specific risk occurrence [3]. Evidence shows that the severity of the impact emanating from the disaster is highly dependent on the level of exposure and vulnerability in the affected area. This indirectly increases the level of global disaster risk due to increases in the exposure levels of people and assets to natural disasters [17]. Therefore, it is important to examine the extent of exposure levels for Sabah to earthquake disasters, especially in terms of its population and residential aspects, as preliminary information for disaster preparedness and planning.
In order to measure an exposure vulnerability level of the Sabah community that defines the relative state of the exposure, mathematical approaches combining several variables have been used to produce index maps [23]. A composite index allows for a direct comparison between the relative overall exposure of a district and the relative contributions of various factors to that overall exposure vulnerability [4].
In this study, the exposure vulnerability indicators were identified and constructed. Then, the statistical analysis method was performed to normalize multivariate data with different measurement units, together with a weight calculation of indicator variables. An exposure vulnerability index map was generated and mapped using the spatial analysis function of Geographical Information System (GIS) tools. Finally, the map was overlaid with the seismic hazard map to create a new data layer that displays the information and location of particular areas exposed to earthquake risk. Hence, this development of a new map through the combination of both existing maps provides the potential for a seismic risk assessment of the Sabah municipal district.
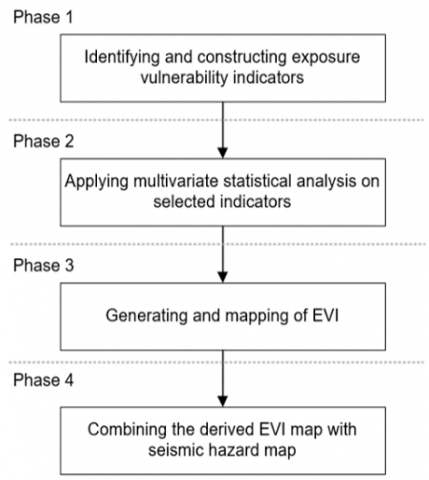
Figure 1. The methodological framework for assessing the EVI
In this study, the researchers applied the qualitative and quantitative approaches, including spatial analysis through the Geographic Information System (GIS) and statistical modeling on a local district scale. The methodological framework (Figure 1) for assessing the exposure vulnerability index (EVI) to seismic risk for Sabah comprised four main phases that were adapted based on the approaches of previous models [3, 24].
2.1 Study area
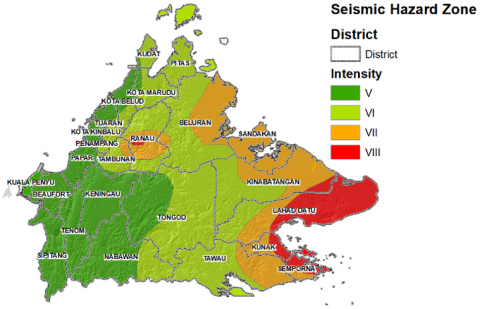
Geographically, Sabah is located in East Malaysia, approximately between longitude E115° and E119°, and latitude N4° and N7°, covering an area of 73,904km2 and with an estimated population of 3.9 million [25]. It is considered to be at moderately active seismic risk through the existence of at least 13 active faults with 65 magnitude earthquakes (magnitude 3.3 to 6.5) having been recorded from 1923 to 2007 [11, 26]. The record of earthquake activity in Sabah is also monitored and updated continuously in the browser of the Incorporated Research Institutions for Seismology (IRIS) and the United States earthquake catalog website (USGS), as shown in Table 1. The active subduction zones of the Manila Trench, Negros Trench, Sulu Trench, Cotabato Trench and North Sulawesi Trench that surround Sabah have had an impact on past and current local and regional earthquakes [27, 28]. The geographical context of the Sabah region and its classification of seismic hazards [29] are shown in Figure 2. Classification is based on Table 2 [30].
Figure 2. Map of the study area and its seismic hazard classification
Seismic hazards refer to hazards related to a potential earthquake in a particular area, and a seismic hazards map displays the relative hazards according to a particular zone area [31]. The development of seismic maps incorporates consideration of fault lines, historical earthquakes, the mechanism of seismic waves during earthquakes and nearby site conditions at specific locations of interest. This type of map is usually beneficial for land-use planning, mitigation and emergency response.
In the Sabah region, Ranau and most of the south-east are the most hazardous territories (Zone VIII) with a high earthquake intensity recorded. Significant earthquake events that have caused considerable damage and fatalities are the Lahad Datu Earthquake (1976), the Ranau Earthquake (1991) and the Ranau Earthquake (2015) [32]. The impact of the Ranau Earthquake on 5 June 2015 on Malaysians, both local residents and the authorities, was to increase efforts and raise awareness of the importance of management and disaster preparedness measures [33]. The majority of the areas lie within Zone V and VI with medium-low seismicity levels. The remaining nearby area surrounds the dangerous area classified as Zone VII, with active seismicity concentrated in the Central North (Ranau) Zone, the Labuk Bay-Sandakan Basin Zone and the Dent-Semporna Peninsula Zone [29, 34].
Table 1. Earthquake catalog (2008 - 2018) in Sabah
Sources: IRIS earthquake browser and USGS earthquake catalogue websites
|
YEAR |
MONTH |
DAY |
TIME UTC |
MAGNITUDE |
LATITUDE |
LONGITUDE |
DEPTH (KM) |
PLACE |
|
2018 |
3 |
8 |
13:06:13 |
5.2 |
06.037 |
116.6059 |
10 |
Ranau |
|
2017 |
3 |
26 |
09:30:48 |
4.6 |
4.9334 |
118.7791 |
34 |
Lahad Datu |
|
2016 |
3 |
4 |
00:43:35 |
4.1 |
4.9182 |
118.4359 |
35 |
Lahad Datu |
|
2015 |
6 |
4 |
23:15:45 |
6.0 |
6.0439 |
116.6651 |
18.1 |
Ranau |
|
2015 |
6 |
12 |
18:29:18 |
5.2 |
6.0674 |
116.6210 |
28.3 |
Ranau |
|
2015 |
6 |
6 |
05:45:15 |
4.6 |
06.188 |
116.7836 |
10 |
Ranau |
|
2015 |
6 |
23 |
09:32:33 |
4.5 |
6.0491 |
116.5472 |
35 |
Ranau |
|
2015 |
6 |
12 |
18:25:39 |
4.4 |
06.039 |
116.5783 |
35 |
Ranau |
|
2015 |
6 |
5 |
15:13:35 |
4.4 |
6.2153 |
116.8726 |
10 |
Ranau |
|
2015 |
3 |
19 |
21:56:04 |
4.1 |
5.6182 |
118.6962 |
35 |
Sandakan |
|
2014 |
2 |
1 |
11:35:10 |
4.6 |
6.1136 |
116.5807 |
15.6 |
Kota Belud |
|
2014 |
9 |
5 |
01:15:53 |
4.3 |
4.5819 |
118.3607 |
10 |
Semporna |
|
2012 |
5 |
28 |
16:44:14 |
4.8 |
4.8168 |
118.2948 |
40 |
Sabah |
|
2010 |
8 |
21 |
19:43:33 |
4.2 |
5.1917 |
118.1427 |
35 |
Sabah |
|
2008 |
5 |
18 |
06:26:46 |
5.0 |
04.598 |
118.1668 |
45.9 |
Sabah |
|
2008 |
4 |
9 |
00:51:46 |
4.5 |
4.9453 |
118.7655 |
44 |
Sabah |
Table 2. Comparison of Richter Scale Magnitude with Modified Mercalli Intensity (MMI) Scale
|
Magnitude |
Maximum Modified Mercalli Intensity |
|
1.0 – 3.0 |
I |
|
3.0 – 3.9 |
II – III |
|
4.0 – 4.9 |
IV – V |
|
5.0 – 5.9 |
VI – VII |
|
6.0 – 6.9 |
VII – IX |
|
> 7.0 |
VIII and above |
2.2 Identifying and constructing exposure vulnerability indicators
The first important phase in the methodology of this study was the identification and construction of the list and the number of exposure vulnerability indicator variables. This step involved a literature review and an expert consultation process. Once the assessment scope had been defined, secondary data and documents were gathered from related agencies. The Department of Statistics Malaysia (DOSM) is the crucial agency responsible for managing and providing the census data of Malaysia. Data is collected and organized based on the need to identify and construct exposure vulnerability indicators at the district level.
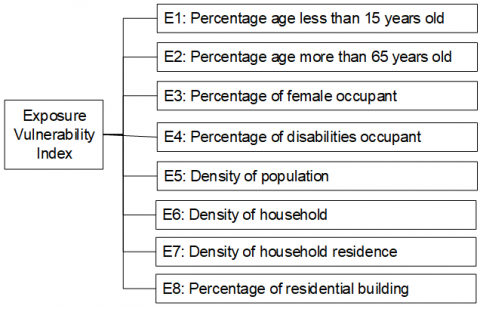
Figure 3. Structure of exposure vulnerability index (EVI) assessment
Theoretically, in a parameter study, the scale of seismic vulnerability research is directly proportional to the number of parameters or variables affecting it [35]. For example, on a small scale, the number of objects (e.g. buildings) increases rapidly. If too many factors are involved in the operation, not all the data could be obtained and modeled. However, a larger number of indicator variables would improve the accuracy of the calculation [36]. Most variables in this research were derived directly from census data and available data. Furthermore, the study was designed in the form of a structure for an EVI assessment, as shown in Figure 3. The following indicators were selected (Table 3) based on data availability, previous research and expert opinion.
Table 3. List and description of exposure indicator variables
|
Variable indicator |
Descriptive analysis |
|
Age structure (less than 15 years old)
|
In disaster events, children and older people are the most vulnerable groups as they affect the response activities during a disaster. Furthermore, affected day-care facilities would require time and financial support to take care of children. Sources: [23, 37, 38]
Most children, especially in younger age groups, could not protect themselves and cope effectively during a disaster due to a lack of tools, expertise or life experience. Sources: [39-41] |
|
Age structure (more than 65 years old)
|
Increased treatment burdens and a lack of resilience could occur among the elderly with mobility problems or mobility restrictions. Sources: [24, 38, 40, 41]
Elderly people living alone are more inclined to be dependent and likely to be more vulnerable to disasters. Most older people have special needs and require the assistance of others, especially when facing disasters. Sources: [39] |
|
Gender (female occupant)
|
Gender affects vulnerability, such that women would find it more difficult to recover than men, mostly due to sector-specific jobs, lower wages, and family care obligations. Sources: [24, 37, 38, 42] |
|
Disabilities occupant |
Most people of all ages with disabilities who have physical, sensory, or cognitive challenges need special help and assistance as they would be more vulnerable to disasters. Sources: [39, 43] |
|
Population density
|
A population that is assigned to each zone based purely on census records is the crucial non-seismic and non-structural factor to assess vulnerability.
The rapid growth experienced by certain districts would lead to poor quality housing, and social service networks would insufficient time to adapt to expanding populations. New migrants who are unfamiliar with the local language and culture would make it difficult to deliver information on relief or disaster recovery, which would inadvertently increase vulnerability levels. A high population density affects any evacuation process. Sources: [24, 38-41, 44] |
|
Household and household residence density
|
Family units with high birth rates, large families or single-parent households often have minimal outsourcing costs for dependent care. As a result, their durability and recovery during disasters are affected. Sources: [24, 42] |
|
Building (residential) density
|
Most injuries or deaths during an earthquake have been caused by collapsing walls or large objects falling from buildings. The factor of building density affects vulnerability, though the incidence rate is low. Areas with low building density have low levels of vulnerability and vice versa. The density of buildings is measured by the number of physical buildings compared to the number of areas that are most likely to be affected by an earthquake. Sources: [38, 45] |
2.3 Multivariate statistical analysis on exposure indicator
The second phase was the construction of an EVI that was developed through multivariate statistical analysis. The Iyengar and Sudarshan methods were applied to normalize and calculate the weight of each variable in this study, in accordance with the availability and feasibility of the required input data, and the conditions of the study area [36, 46]. All multivariate datasets were standardized with the normalization process, using linear min-max in Eq. (1). The value scores of each variable were scaled to a standard range between 0 and 1.
$\mathrm{xij}=\frac{\left(\mathrm{x}_{\mathrm{ij}}-\mathrm{Min} \mathrm{x}_{\mathrm{ij}}\right)}{\left(\mathrm{Max} \mathrm{x}_{\mathrm{ij}}-\operatorname{Min} \mathrm{x}_{\mathrm{ij}}\right)},\left(0 \leq \mathrm{x}_{\mathrm{ij}} \leq 1\right)$ (1)
Based on the equation;
|
Xij |
= |
normalized value of the indicator i of the component j |
|
xij |
= |
value of the indicator i |
|
Max(xij) |
= |
the maximum values of the indicators i of the component j respectively |
|
Min (xij) |
= |
the minimum values of the indicators i of the component j respectively |
The next step was to calculate the linear sum of xij using Eq. (2), where:
$\overline{\mathrm{y}}_{\mathrm{i}}=\sum_{\mathrm{j}=1}^{\mathrm{K}} \mathrm{W}_{\mathrm{j}} \mathrm{X}_{\mathrm{ij}}$ (2)
|
M |
= |
region or districts |
|
K |
= |
indicators of vulnerability |
|
xij |
= |
normalized scores (i = 1, 2, …, M; j = 1, 2, ….., K) |
|
wj |
= |
weight of indicator variable $(0<\mathrm{w}<1)$ and $\sum_{\mathrm{i}=1}^{\mathrm{K}} \mathrm{w}_{\mathrm{j}}=1$ |
The weights were meant to differ inversely, as the difference between regions is the respective exposure measured. The contribution or weight (wj) of different indicator variables was determined by Eq. (3) and Eq. (4) where c represents the normalizing constant.
$\mathrm{W}_{\mathrm{j}}=\mathrm{c} / \sqrt{\operatorname{var}\left(\mathrm{x}_{\mathrm{ij}}\right)}$ (3)
$\mathrm{c}=\left[\sum_{\mathrm{i}=1}^{\mathrm{j}=\mathrm{K}} 1 / \sqrt{\operatorname{var}\left(\mathrm{x}_{\mathrm{ij}}\right)}\right]-1$ (4)
In this method, the selection of weights would ensure that the contribution of the remaining factors would not be excessively influenced by significant differences in any of the variables and would not mislead inter-regional comparisons. The calculated weight for the variable indicator is shown in Table 4.
Table 4. Calculated weight for exposure indicator variables
|
Variable indicator |
Abbreviation |
Weight |
|
Age structure (less than 15 years old) |
E1 |
0.1059 |
|
Age structure (more than 65 years old) |
E2 |
0.1043 |
|
Gender (female occupant) |
E3 |
0.1101 |
|
Disabilities occupant |
E4 |
0.1333 |
|
Population density |
E5 |
0.1270 |
|
Household density |
E6 |
0.1339 |
|
Household residence density |
E7 |
0.1359 |
|
Building (residential) density |
E8 |
0.1496 |
After the construction of the EVI, the third phase methodology involved spatial data analysis to generate and produce the exposure vulnerability index map.
2.4 Generating and mapping the exposure vulnerability index map
After generating the exposure criteria structure with the selection of indicators, normalization and weighting, composite index maps were generated using ArcGIS software. The data for each variable indicator was mapped to display its spatial distribution (Figure 4). The shifting of colors from light to dark on the map represents the increasing amount of data for the respective variable. In order to produce an EVI map, spatial analysis such as polygon to raster, reclassify and weighted sum were then performed. The ModelBuilder function in this software was used to model the spatial analysis workflows, as shown in Figure 5.
Figure 4 Spatial distribution of exposure indicators
Figure 5. GIS modeling for the exposure vulnerability index (EVI) map development
The derived maps were then classified based on the pixel values using the standard deviation method. The final map was classified according to the value of each category as follows: Low (< -0.5 Std. Dev), Moderate (-0.5 < Std. Dev < 0.5), High (0.5 < Std. Dev < 1.5) and Very High (Std. Dev > 1.5) [22, 40, 41].
2.5 Combining the exposure vulnerability index (EVI) map with a seismic hazard map
The final phase in the methodology was to overlay the exposure vulnerability index map (EVImap) (Figure 6) with the seismic hazard map (Hmap) (Figure 2) in order to produce a map with the potential for seismic risk assessment. Reclassified and weighted sum functions were applied to overlay those maps, multiplying each by their given weight and summing them together, as shown in Eq. (5).
Potential seismic risk map $=\mathrm{EVI}_{\operatorname{map}} \times$ Hazard $_{\operatorname{map}}$ (5)
The results and discussion following this research are explained in two sub-topics as follows:
3.1 Combining the exposure vulnerability index (EVI) map with a seismic hazard map
The outputs of the geospatial analysis of the EVI map are shown in Figure 6, together with the statistics of the exposure vulnerability index values distribution generated by GIS software.
Figure 6. Exposure vulnerability index map generated using ArcGIS software
Out of all the 25 districts in Sabah, the exposure vulnerability index map shows that most districts are seen to have relatively low and moderate levels with a small mean value. The mean value was 0.020 and the standard deviation was 0.023 (Figure 7) indicating a lower level of exposure index due to the low variance value. In contrast, the relatively greater standard deviation value indicates a higher variance value or a higher exposure level for a district.
Figure 7. Classification statistics generated by GIS software
However, a few districts, especially the major cities in Sabah, are rated as high and very high in the exposure index. There is overall uniformity in the exposure levels throughout the region, with over 85% (21) of the districts in the range of less than +0.5 standard deviation (Figure 6). The minimal presence of vulnerable groups (i.e. children, elderly, female and disabled occupants) is the major contributory factor to the uniform exposure index across the region. Only 8% (2) of the districts located in the red zone show a standard deviation larger than 1.5, which are the Kota Kinabalu and Penampang areas. Correspondingly, only 8% (2) of the districts are in the high-level (orange) zone (Sandakan and Tawau municipalities) with a standard deviation between +0.5 and +1.5. The highest exposure index in the state was due to the highest percentage of children, elderly, female occupants and disabled occupants. In addition, the largest population density and residential building density reported in the district further exacerbated the higher level of exposure in the area. Based on the available data, most districts have a moderate to low exposure level, indicating a moderate or low level of vulnerability.
3.2 Combination of exposure vulnerability index (EVI) map and seismic hazard map
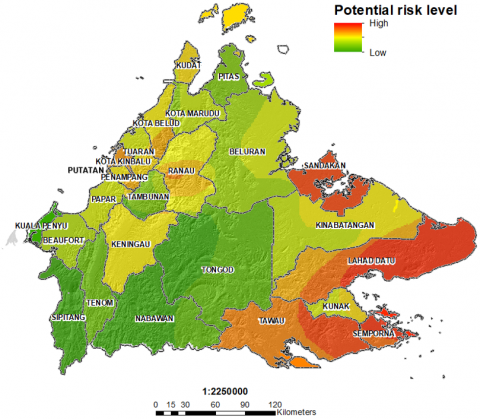
One of the primary findings derived from the EVI map was an assessment of combined risk scenarios by integrating the earthquake hazard with areas exposed to natural disasters, especially earthquake events. The potential seismic risk map derived from the combination of the exposure and seismic hazard maps is shown in Figure 8. The cumulative representation of these variables on a map is perhaps most useful as an instrument for determining with greater accuracy the geographic location of the most vulnerable and their exposure to seismic hazard events. Indirectly, these results are expected to assist policymakers and investors in developing risk-reduction strategies.
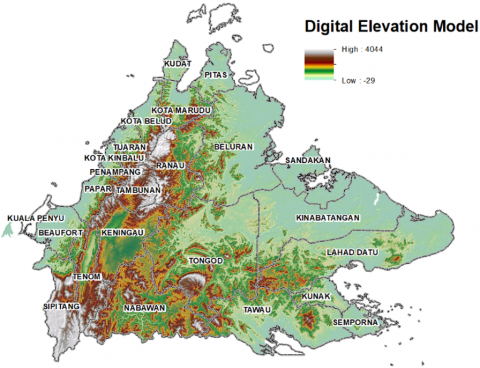
The southwest and central parts of the area are not at risk because they lay in Zone V, which does not include the possibility of an earthquake occurrence. In terms of exposure index, the population density here is lower than other parts of Sabah due to the limited accessibility of these mountainous and hilly morphological areas (Figure 9). Among the districts are Sipitang, Tenom, Nabawan, and Tongod. Additionally, the physical surface of the terrain also results in a low density of residential buildings.
In the northwest, apart from the Ranau district where earthquakes occur frequently despite a low probability of seismic hazard, researchers found some high-level exposure instances that would contribute to them being deemed 'at risk'. This includes Kota Kinabalu, Sabah's capital, which is surrounded by the Penampang and Putatan suburbs, considered part of the Greater Kota Kinabalu area. Those districts consistently recorded the highest number of every exposure indicator variable, resulted in their having the highest exposure index in Sabah. Furthermore, the location in Zone V had caused the area to be classified as ‘at risk’ of earthquakes.
Figure 8. Output for the EVI and seismic hazard maps combination
Figure 9. Digital Elevation Model (DEM) represents the Sabah terrain surface
The most at-risk part is the southeast zone, with high seismic hazards (Zone VIII). It also has a high level of exposure due to its large population of children (aged under 15 years old), the elderly (aged over 65 years old), female residents and disabled people, factors that lead to the increased impact of earthquakes. Furthermore, according to the exposure index, Sandakan and Tawau are among the major cities in Sabah with a high density of residential buildings.
Finally, the Sandakan, Lahad Datu, Semporna and Tawau areas are the most at-risk, because they all satisfied both assessment criteria, have high exposure indices, and are located within the most dangerous earthquake area (Zone VII and Zone VIII). Those districts deserve particular attention from the responsible agencies because they are the most populated at-risk areas, with a high number of occupants and residential density.
In this paper, the researchers proposed a methodology for establishing a technique that focuses on a socio-economic analysis of the population of Sabah and its residential areas, and which is capable of classifying areas into different capacities to respond to earthquake disasters. This provides a beneficial tool for measuring the exposure index, but a comprehensive understanding of the components is needed, as is a knowledge of how these variables interact and inevitably lead to the vulnerability of a population on a regional scale. A significant selection of population and residential indicators for evaluating the exposure vulnerability index for Sabah are among the main findings in this study. In addition, multivariate statistical analysis serves as an instrument for standardizing and calculating the weight of each variable. Geostatistical methods were applied to evaluate the indicators spatially in producing cartographic representations showing the regional homogeneity and directional representation across the regions. The combination of the indicator maps produced the final exposure index map.
The visualization of the EVI map provides a relevant basis for the interpretation of spatial variability in Sabah’s exposure vulnerability that could be used in the initial stage of district planning. The research also shows the significance of integrating the exposure vulnerability map with a seismic hazards map in producing a new qualitative potential seismic risk map.
Most exposure indicators derived from the census data that provide a good source of information on numerous aspects are particularly useful for generating the vulnerability index. However, the use of census data alone should be made with caution, as it only represents information at a household level without considering other aspects, such as the contribution of resilience and the capacity component to the vulnerability level. Therefore, future advancements are expected to determine the spatial relationship between all components of vulnerability, which include exposure, resilience, and capacity indicators, together with seismic hazards, and enable the production of a holistic seismic risk map through a GIS-based approach.
Finally, the findings from this study might assist in the provision of a strategic vision of seismic processes that could interfere with human populations. Thus, for those countries that are still in the early stages of implementing effective earthquake disaster management, the introduction of exposure risk components would be of great value due to their provision of preliminary information on disaster preparedness and planning. Moreover, the set of indicators and methodologies proposed in this study could be adopted for use with any region of Malaysia and is suitable for replication across various scales, dynamics and regional variations.
The researchers would like to express their gratitude to the government agencies (i.e., DOSM, Department of Mineral and Geoscience Malaysia (JMG) and National Geospatial Centre (PGN)) for contributing the main data used in this study. This research supported through TIER1 UTHM grant (vot: H810) and HLP Doctoral Scholarships by Ministry of Higher Education Malaysia (MOHE). Special thanks for the critical reviews provided by reviewers that helped greatly in improving our paper.
[1] Uitto, J.I. (1998). The geography of disaster vulnerability in megacities. Appl. Geogr., 18(1): 7-16. http://dx.doi.org/10.1016/S0143-6228(97)00041-6
[2] Calvi, G.M., Pinho, R., Magenes, G., Bommer, J.J., Restrepo-Vélez, L.F., Crowley, H. (2006). Development of seismic vulnerability assessment methodologies over the past 30 years. ISET J. Earthq. Technol., 43(3): 75-104.
[3] Birkmann, J., Cardona, O.D., Carreño, M.L., Barbat, A.H., Pelling, M., Schneiderbauer, S., Kienberger, S., Keiler, M., Alexander, D., Zeil, P., Welle, T. (2013). Framing vulnerability, risk and societal responses: The MOVE Framework. Nat. Hazards, 67(2): 193-211. http://dx.doi.org/10.1007/s11069-013-0558-5
[4] Davidson, R.A. (1997). A multidisciplinary urban earthquake disaster risk index. Earthq. Spectra, 13(2): 211-223. https://doi.org/10.1193/1.1585942
[5] Bohle, H.G. (2001). Vulnerability and criticality: perspectives from social geography. Newsletter of the International Human Dimensions Programme on Global Environmental Change, 2: 1-6.
[6] ADPC. (2003). Asian Disaster Preparedness Center: Third Regional Training Course on Earthquake Vulnerability Reduction for Cities. Dhaka, Bangladesh.
[7] UN-ISDR. (2017). Terminology on Disaster Risk Reduction. https://www.unisdr.org/we/inform/terminology, accessed on 14-Mar-2019.
[8] De Leon, J.C.V. (2006). Vulnerability: A Conceptual and Methodological Review, vol. 4. Germany, 2006.
[9] Carreño, M.L., Cardona, O.D., Barbat, A.H. (2007). Urban seismic risk evaluation: A holistic approach. Nat. Hazards, 40(1): 137-172. http://dx.doi.org/10.1007/s11069-006-0008-8
[10] Birkmann, J. (2007). Risk and vulnerability indicators at different scales: Applicability, usefulness and policy implications. Environ. Hazards, 7(1): 20-31. http://dx.doi.org/10.1016/j.envhaz.2007.04.002
[11] Adnan, A., Ramli, M.Z., Abd Razak, S.M. (2015). Disaster management and mitigation for earthquakes: are we ready? in 9th Asia Pacific Structural Engineering and Construction Conference (APSEC2015), pp. 34-44.
[12] Indan, E., Roslee, R., Tongkul, F., Simon, N. (2018). Earthquake vulnerability assessment (EVAS): Analysis of environmental vulnerability and social vulnerability in Ranau Area, Sabah, Malaysia. Geol. Behav., 2(1): 24-28. http://dx.doi.org/10.26480/gbr.01.2018.24.28
[13] Ghafar, M., Ramly, N., Alel, M., Adnan, A., Mohamad, E.T., Yunus, M.Z.M. (2015). A simplified method for preliminary seismic vulnerability assessment of existing building in Kundasang, Sabah, Malaysia. J. Teknol., 72(3): 1-7. http://dx.doi.org/10.11113/jt.v72.4003
[14] Okazaki, K. (2000). RADIUS: Risk Assessment Tools for Diagnosis of Urban Areas against Seismic Disasters. Geneva, Switzerland, 2000.
[15] Mazumder, R.K., Salman, A.M. (2018). Seismic damage assessment using RADIUS and GIS: A case study of Sylhet City, Bangladesh. Int. J. Disaster Risk Reduct., 34: 243-254. http://dx.doi.org/10.1016/j.ijdrr.2018.11.023
[16] Chakraborty, A., Joshi, P.K. (2016). Mapping disaster vulnerability in India using analytical hierarchy process. Geomatics, Nat. Hazards Risk, 7(1): 308-325. http://dx.doi.org/10.1080/19475705.2014.897656
[17] UNISDR. (2016). UNISDR Science and Technology Conference on the implementation of the Sendai Framework for Disaster Risk Reduction 2015- 2030: Exposure and Vulnerability.
[18] Raduan, R., Daud, M.E., Kaamin, M. (2018). Applications GIS for earthquake threat mapping in Sabah. in MATEC Web of Conferences, vol. 07001. http://dx.doi.org/10.1051/matecconf/201825007001
[19] Roslee, R., Termizi, A.K., Indan, E., Tongkul, F. (2018). Earthquake vulnerability assessment (EVAs): A study of physical vulnerability assessment in Ranau area, Sabah, Malaysia. ASM Sci. J., 11(2): 66-74.
[20] Sauti, N.S., Daud, M.E., Kaamin, M. (2020). Construction of an integrated social vulnerability index to identify spatial variability of exposure to seismic hazard in Pahang, Malaysia. Int. J. Des. Nat. Ecodynamics, 15(3): 365-372. http://dx.doi.org/10.18280/ijdne.150310
[21] Sauti, N.S., Daud, M.E., Kaamin, M. (2020). Proposed method and framework for evaluating and calculating a seismic vulnerability index of malaysia proposed method and framework for evaluating and calculating a seismic vulnerability index of Malaysia. in IOP Conference Series: Earth and Environmental Science, 2020, 616: 012034. http://dx.doi.org/10.1088/1755-1315/616/1/012034
[22] Aksha, S.K., Juran, L., Resler, L.M., Zhang, Y. (2019). An analysis of social vulnerability to natural hazards in nepal using a modified social vulnerability index. Int. J. Disaster Risk Sci., 10(1): 103-116. http://dx.doi.org/10.1007/s13753-018-0192-7
[23] Dewan, A. (2013). Floods in a megacity: Geospatial techniques in assessing hazards, risk and vulnerability. (A. M. Dewan, Ed.) Floods in a Megacity : Geospatial Techniques in Assessing Hazards, Risk and Vulnerability (p.219). Dordrecht: Springer., 2013.
[24] Cutter, S.L., Boruff, B.J., Shirley, W.L. (2003). Social vulnerability to environmental hazards. Soc. Sci. Q., 84(2): 242-261. http://dx.doi.org/10.1111/1540-6237.8402002
[25] DOSM. (2019). Official Portal of Department of Statistic Malaysia: Statistic of Sabah. Department of Statistic Malaysia, https://www.dosm.gov.my/v1/index.php?r=column/cone&menu_id=dTZ0K2o4YXgrSDRtaEJyVmZ1R2h5dz09, accessed on 30-Nov-2019.
[26] Zainal, Z., Mokhtar, Z.A., Fatt, C.M., Mat Said, S.N., Neo, I.E.S., Che Abas, M.R. (2011). The Effectiveness of Public Awareness Campaigns on Earthquake and Tsunami in Malaysia. Malaysia, 2011.
[27] Koh, H.L., Teh, S.Y., Majid, T.A., Lau, T.L., Ahmad, F. (2012). Earthquake and tsunami research in USM: The role of Disaster Research Nexus. Pertanika J. Sci. Technol., 20(1): 151-163.
[28] Lam, N., Tsang, H.H., Looi, D., Lumantarna, E., Wilson, J. (2016). Seismic hazard modelling for Malaysia. in Australian Earthquake Engineering Society 2016 Conference, Nov 25-27, 2016.
[29] DSM. (2017). Malaysia National Annex to Eurocode 8: Design of structures for earthquake resistance - Part 1: General rules, seismic actions and rules for buildings (Department of Standards Malaysia).
[30] PLANMALAYSIA. (2018). Guidelines for Development Planning and Management in Earthquake Disaster Risk Areas.
[31] USGS, “What is seismic hazard?,” 2018. Available: https://www.usgs.gov/faqs/what-seismic-hazard-what-a-seismic-hazard-map-how-are-they-made-how-are-they-used-why-are-there?qt-news_science_products=7#qt-news_science_products, accessed on 24-Oct-2018.
[32] Tongkul, F. (2015). The 2015 Ranau Earthquake: Cause and Impact. Sabah Soc., 32: 1-28.
[33] Adiyanto, M.I., Majid, T.A., Nazri, F.M. (2017). Nonstructural damages of reinforced concrete buildings due to 2015 Ranau earthquake. In AIP Conference Proceedings, 1865(1). http://dx.doi.org/10.1063/1.4993403
[34] Alexander, Y. (2011). Geological assessment of the earthquake sources and hazard in Malaysia. Malaysia, 2011.
[35] Asef, M.R. (2006). Introducing a national earthquake vulnerability index. in Energy, 563: 1-5.
[36] Duong, H.H., Thuc, T., Ribbe, L. (2016). Assessing and calculating a climate change vulnerability index for agriculture production in the Red River Delta, Vietnam. in Redefining Diversity and Dynamics of Natural Resources Management in Asia, Vietnam: Elsevier Inc., 2016, 2: 27-40. http://dx.doi.org/10.1016/B978-0-12-805453-6.00003-6
[37] Martins, V.N., e Silva, D.S., Cabral, P. (2012). Social vulnerability assessment to seismic risk using multicriteria analysis : the case study of Vila Franca do Campo (Sao Miguel Island, Azores, Portugal). Nat. Hazards, 385-404. http://dx.doi.org/10.1007/s11069-012-0084-x
[38] Bahadori, H., Hasheminezhad, A., Karimi, A. (2017). Development of an integrated model for seismic vulnerability assessment of residential buildings: Application to Mahabad City. Iran. J. Build. Eng., 12: 118-131. http://dx.doi.org/10.1016/j.jobe.2017.05.014
[39] Flanagan, B.E., Gregory, E.W., Hallisey, E.J., Heitgerd, J.L., Lewis, B. (2011). A social vulnerability index for disaster management. J. Homel. Secur. Emerg. Manag., 8(1): 1-22. http://dx.doi.org/10.2202/1547-7355.1792
[40] Frigerio, I., Ventura, S., Strigaro, D., Mattavelli, M., De Amicis, M., Mugnano, S., Boffi, M. (2016). A GIS-based approach to identify the spatial variability of social vulnerability to seismic hazard in Italy. Appl. Geogr., 74: 12-22. http://dx.doi.org/10.1016/j.apgeog.2016.06.014
[41] Azzimonti, O.L., Colleoni, M., De Amicis, M., Frigerio, I. (2019). Combining hazard, social vulnerability and resilience to provide a proposal for seismic risk assessment. J. Risk Res., 23(9): 1225-1241. http://dx.doi.org/10.1080/13669877.2019.1646308
[42] Morrow, B.H. (1999). Identifying and mapping community vulnerability. Disasters, 23(1): 1-18. https://doi.org/10.1111/1467-7717.00102
[43] Ronoh, S., Gaillard, J.C., Marlowe, J. (2015). Children with disabilities and disaster risk reduction: A review. Int. J. Disaster Risk Sci., 6(1): 38-48. http://dx.doi.org/10.1111/1467-7717.00102
[44] Rafiq, L., Blaschke, T. (2012). Disaster risk and vulnerability in Pakistan at a district level. Geomatics, Nat. Hazards Risk, 3(4): 324-341. https://doi.org/10.1080/19475705.2011.626083
[45] Armaş, I., Toma-Danila, D., Ionescu, R., Gavriş, A. (2017). Vulnerability to earthquake hazard: Bucharest case study, Romania. Int. J. Disaster Risk Sci., 8(2): 182-195. http://dx.doi.org/10.1007/s13753-017-0132-y
[46] Iyengar, N., Sudarshan, P. (1982). A method of classifiying regions from multivariate data. Econ. Polit. Wkly., 17(51): 2048-2052.