Sarmad Dashti Latif* | Muhammad Shukri Bin Nor Azmi | Ali Najah Ahmed | Chow Ming Fai | Ahmed El-Shafie
© 2020 IIETA. This article is published by IIETA and is licensed under the CC BY 4.0 license (http://creativecommons.org/licenses/by/4.0/).
OPEN ACCESS
Water resources play a vital role in various economies such as agriculture, forestry, cattle farming, hydropower generation, fisheries, industrial activity, and other creative activities, as well as the need for drinking water. Monitoring the water quality parameters in rivers is becoming increasingly relevant as freshwater is increasingly being used. In this study, the artificial neural network (ANN) model was developed and applied to predict nitrate (NO3) as a water quality parameter (WQP) in the Feitsui reservoir, Taiwan. For the input of the model, five water quality parameters were monitored and used namely, ammonium (NH3), nitrogen dioxide (NO2), dissolved oxygen (DO), nitrate (NO3) and phosphate (PO4) as input parameters. As a statistical measurement, the correlation coefficient (R) is used to evaluate the performance of the model. The result shows that ANN is an accurate model for predicting nitrate as a water quality parameter in the Feitsui reservoir. The regression value for the training, testing, validation, and overall are 0.92, 0.93, 0.99, and 0.94, respectively.
water quality parameter, artificial neural network (ANN), nitrate concentration, Feitsui reservoir
Water is the key component of the environment, a vital natural resource, and a national asset. In rivers, lakes, soil, rainwater, glaciers, etc., the primary source of water is probable. The monitoring of water quality parameters in rivers is becoming more relevant as freshwater is increasingly being used. The field monitoring and processing of freshwater takes time and is costly. Data-driven approaches are widely used to determine water quality characteristics. Water resources also play a vital role in various economies as agriculture, forestry, cattle farming, hydropower generation, fisheries, industrial activity, and other creative activities, as well as the need for drinking water. The supply and quality of water, be it surface or land, has degraded because of some important factors such as population growth, urbanization, industrialization, etc. [1, 2].
Rivers are critical for providing a precondition for aquatic species and public health as reliable sources of surface water [3]. In recent years, anthropogenic (industrial, urban, agricultural) and natural processes (pluvial inputs, deforestation, and the seasonal effects) led to high levels of land contaminants in marine environments [4]. This decreased quality of water resources put pressure on maintaining the river habitats and diminished biodiversity and access to waterways. Consequently, it is important to preserve freshwater sources and recognize factors that affect water quality in streams [5].
Nowadays, due to water conservation administration, the market for forecasting techniques has increased. A variety of ANN approaches have recently been used to forecast water quality and to classify the water quality index using independent variables, including DO, chemical oxygen demand (COD), biological oxygen demand (BOD), suspended solids (SS), nitrate-nitrogen (NO3-N), and pH. A water quality assessment and laboratory analysis are reliable using standard water samples and increases time consumption [6]. Additionally, a full pollution index is calculated for the samples. The contamination index method provides an assessable description of low, heavy, or extremely high-water quality but does not distinguish between categories of functional water. A pH, total solids (TS), T-Hard, T-Alk, potassium (K+), chloride (Cl-), PO4, sodium (Na+), N-NO3, ammonium nitrogen (NH4-N), and COD multi-layered neural perceptive network predicts demands for total dissolved solids, dissolved oxygen, and biochemical oxygen [7, 8].
Azad et al. [9] investigated the application of GA, ACOR and DE to boost the efficiency of ANFIS, to test the quality parameters of Gorganroud River water, such as Electrical Conductivity (EC), Sodium Absorption Ratio (SAR) and Total Hardness (TH). Using sensitivity analysis, they calculated the most suitable inputs for each model and then predicted all the output parameters using the said models. It was shown, according to their investigations, that ANFIS-DE with R2 values of 0.98 and 0.97, respectively, and RMSE values of 73.03 and 49.55 and also MAPE values of 5.16 and 9.55, were the most suitable models for predicting EC and TH in the test stage. In addition, the ANFIS-DE and ANFIS-GA models performed best in SAR prediction (R2 = 0.95, 0.91; RMSE = 0.43, 0.37 and MAPE = 13.43, 13.72) in the test stage. It is noteworthy that in the training stage, ANFIS has shown the best performance in predicting all of the listed water quality parameters. Their results indicated the ability of the algorithms listed to boost ANFIS 'accuracy in predicting the quality parameters of river water. However, it should be noted ANFIS-DE and ANFIS-GA had a different operation in statistic indexes; they were in the first order. In these two models, even though ANFIS-DE had more suitable R2 and MAPE, but had higher RMSE, and it made the comparison difficult.
Kadam et al. [10] applied ANN and MLR methods to forecast groundwater quality fitness for drinking from the Shivganga River basin, located on the eastern slopes of India 's western Ghats area. They collected thirty-four (34) representative groundwater samples and analyzed the pre- and post-monsoon seasons of 2015 for major cations and anions. According to their investigations, it demonstrated that ANN model predictions are adequate and confirm consistently reasonable performance for both seasons. In the pre-monsoon season, the initial error was high, but after taking the number of iterations, it has been lowered but still not eliminated.
Stamenković et al. [11] developed a model based on ANN that aims to predict the concentration of nitrates in river water. They monitored and used 26 water quality parameters as input parameters. They trained and tested their models with the data of ten monitoring stations for the period from 2011 to 2016 on the Danube River, located in its course through Serbia. They used two methods, namely, multi-layer perceptron, standard three-layer network, to develop models. Their result showed the ability of ANN to predict the nitrate concentration in both developed models with a value of the mean absolute error of 0.53 and 0.42 mg/L for the test data. The shortcoming of this study was that among 26 parameters, only 8 shows a significant deviation from the skewness and kurtosis limit values. These results indicate that the model can have reduced prediction accuracy.
By combining ANN with GA to forecast the overall performance of DWTPs nationally in China, Zhang et al. [12] developed a hybrid statistic model called HANN. They used data from 45 DWTPs monthly across China. They chose WQP such as temperature and COD and operational parameters such as electricity consumption and chemical consumption as input variables while the processing of drinking water was used as output. They optimized the structure of the HANN model based on the lowest MSE as the indicator. Their scenario analysis showed that the HANN model was capable of predicting variations in water output on the basis of variations in parameters, suggesting that the HANN model may be a general management tool for policymakers and managers of DWTP to prepare prior to regulatory changes, variations in source water quality and market demand. On the other hand, it was observed that the interactions of significant variables and insignificant variables resulted in a significant impact on model performance. This might suggest that when studying complex water treatment systems, a sensitivity analysis of model results that focused on individual input parameters was not sufficient.
Darwishe et al. [13] applied coupling geographic information systems and artificial neural networks (GIS/ANN) in the spatial nitrates forecasting in the chalk aquifer in Bethune, North of France. They compared the result of their proposed model with the numerical modeling (MT3D) results obtained and checked by the actual measurements. The findings show the potential of ANN modeling of spatially dispersed hydrogeological data for nitrate emission control at groundwater. In terms of groundwater management, GIS/ANN modeling is an alternative data analysis to obtain fast results using a less complicated approach whose results are satisfactory. However, due to the lack of data in the unconfined part, where the nitrate concentration varies between 50 and 90 mg/l, the correlation between observed and predicted nitrate concentration was poorer.
Therefore, in this study, ANN is implemented to forecast nitrate as a water quality parameter in the feitsui reservoir. The correlation coefficient is used as a statistical index to examine the efficiency of the model. The main objective of this study is to test the ANN model to forecast WQPs in the Feitsui reservoir.
2.1 Study area
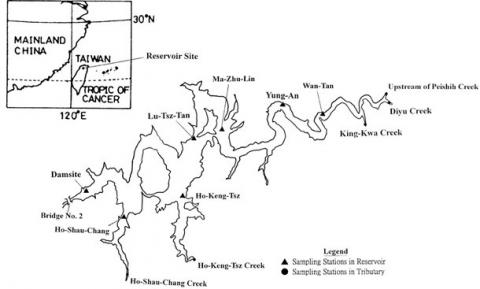
The Feitsui reservoir (Figure 1), constructed in 1987, is planned to be the primary water source in Taipei's metropolitan area for more than five million people and has an initial build capacity of 406x 106 meters. A dam area on the downstream side of Peishih Creek, a tributary of Hsintien Creek, is situated in the Feitsui reservoir district and about 30 km (Figure 1) from Taipei City. Although flood control is not a system capability, a small power plant has an output capacity of 70 MW. With a mean depth of 39.68 m, the Feitsui Reservoir has a gross surface area of 10.24 km2. The reservoir has an average time of about 150 days. It is one of Taiwan's most-tracked reservoirs. The administrative office of Feitsui Reservoir compiled historical data from 1987 and 1988. The modeling analytics have been accompanied by field data on the temperature of water, DO, chlorophyll-a, and nutrients (total phosphorous, ammonia, and nitrogen) [14].
Figure 1. Sampling station of the study area [14]
2.2 Data acquisition and pre-processing
Twenty-one components present in the Feitsui water store were taken to test to see which water component has a nearby liking to nitrate present in the water and achieve eutrophication. From the information given after some time arrangement, the most relatable components apparently were ammonium particles (NH3), Nitrogen Dioxide (NO2), Dissolve Oxygen (DO), and Phosphate (PO4). Table 1 represents the relationship between NO3 and other parameters.
Table 1. Relationship between NO3 and other parameters (NH3, NO2, DO, and PO4)
|
NO3 |
NH3 |
||
|
Mean |
0.440 |
Mean |
0.046 |
|
Standard Deviation |
0.126 |
Standard Deviation |
0.033 |
|
Sample Variance |
0.016 |
Sample Variance |
0.001 |
|
Range |
0.471 |
Range |
0.141 |
|
Minimum |
0.173 |
Minimum |
0.014 |
|
Maximum |
0.644 |
Maximum |
0.155 |
|
NO3 |
NO2 |
||
|
Mean |
0.440 |
Mean |
0.004 |
|
Standard Deviation |
0.126 |
Standard Deviation |
0.002 |
|
Sample Variance |
0.016 |
Sample Variance |
3.679 |
|
Range |
0.471 |
Range |
0.010 |
|
Minimum |
0.173 |
Minimum |
0.000 |
|
Maximum |
0.644 |
Maximum |
0.010 |
|
NO3 |
DO |
||
|
Mean |
0.440 |
Mean |
7.920 |
|
Standard Deviation |
0.126 |
Standard Deviation |
0.588 |
|
Sample Variance |
0.016 |
Sample Variance |
0.346 |
|
Range |
0.471 |
Range |
3.410 |
|
Minimum |
0.173 |
Minimum |
5.270 |
|
Maximum |
0.644 |
Maximum |
8.680 |
|
NO3 |
PO4 |
||
|
Mean |
0.440 |
Mean |
6.099 |
|
Standard Deviation |
0.126 |
Standard Deviation |
6.161 |
|
Sample Variance |
0.016 |
Sample Variance |
37.96 |
|
Range |
0.471 |
Range |
30.75 |
|
Minimum |
0.173 |
Minimum |
1.335 |
|
Maximum |
0.644 |
Maximum |
32.09 |
2.3 Artificial neural network (ANN)
ANN is a mathematical model influenced by the role of the human nervous biological system. The ANN was first described by McCulloch and Pitts [15] and can be considered as a mathematical model to solve the complex intervals between variables [16].
The explicit mathematical expression used by ANN to measure the expected streamflow can be expressed as follows:
$Y=F_{2}\left[\sum_{i=1}^{m} W_{k j} \times F_{1}\left(A_{j}\right)+b_{o}\right]$ (1)
$A_{j}=\sum_{i=1}^{n} X_{i} W_{j i}+b_{j}$ (2)
where,
Y = output variable
Xi = input variable
Aj = sum of inputs and their weights
F1 = the activation function for the hidden layer
F2 = the activation function for the output layer
Wji = the weight among the input i and the hidden node j
bj = the bias of the hidden neuron j
Wkj = the weight of connection of neuron j in the hidden layer to neuron k in the output layer
bo is the bias of the output node k.
$F_{1}\left(A_{j}\right)=\frac{1}{1+\exp \left(-A_{j}\right)}$ (3)
Since there is no set way of choosing the correct number of hidden nodes in ANN and avoiding drawbacks in the large number of trials and errors from the other hand, the number of hidden nodes has been determined [17-20].
$m=2 \times n+1$ (4)
where,
m = number of neurons
n = number of inputs [21].
Figure 2 shows the architecture process of the ANN regression approach.
Figure 2. The architecture approach and process of neural network regression [22]
Neural network simulators are computer programs that model neural network behavior in artificial or biological ways based on one or a few specific types of neural networks. Typically, they are independent and are not intended to build a general neural network that can be integrated into other applications. Simulators typically have some form of integrated simulation for monitoring the training process, and some simulators simulate the neural network's physical structure. Predictive System Mark-up Language is used in different applications to communicate a neural network system. PMML is an XML-based language that enables applications to define and share PMML and other data mining models.
A neuronal network is a connected node layer computing system that imitates a linked neuron structure in the brain. A neural network can learn from these data to identify patterns, categorize data, and train predicted future events. An abstract layer in a neural network splits the data. The information in speech or images can depend on many factors, such as the human brain. The behavior is defined by its relationship with the frequency or weight of those relationships. In practice, these weights are automatically adjusted by the given learning principle until the neural network properly performs the necessary task [23].
2.4 Model evaluation
As a statistical index, the correlation coefficient is used to evaluate the proposed model. Correlation Coefficient (R) is a test of linear dependence between two variables [24]. For two variables (X, Y), the correlation coefficient (R) can be defined as:
$\mathrm{R}=\frac{\sum\left(X-X_{\text {mean}}\right)\left(Y-Y_{\text {mean}}\right)}{\sqrt{\sum\left(X-X_{\text {mean}}\right)^{2}\left(Y-Y_{\text {mean}}\right)^{2}}}$ (5)
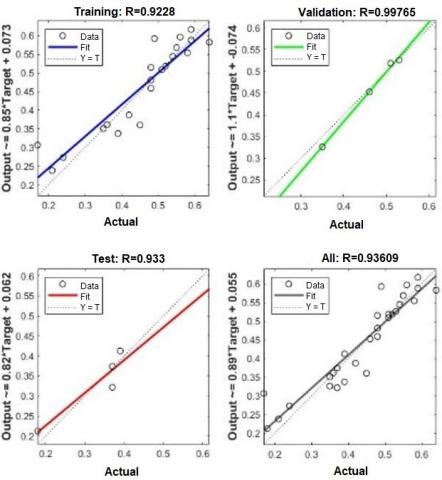
In this research, ANN model applied to predict nitrate (NO3) as a water quality parameter of the Feitsui reservoir, Taiwan. Five water quality parameters (NH3, NO2, DO, NO3, and phosphate PO4) were selected as input variables for the proposed model. The proposed model had been evaluated using the correlation coefficient (R). The dataset was divided into two subsets, training and testing. The partition was done, such that 80% for training and 20% for testing data. Figure 3 shows the regression graph of training, testing, validating, and the overall for the proposed model. Figure 3 shows the actual versus output (predicted) for training, testing, validation, and overall performance of the model. Simple linear regression takes only one independent variable into account. The regression value of training, testing, validation, and overall, of the proposed model are 0.92, 0.93, 0.99, and 0.94, respectively. Table 2 represents the results of the regression value of training, testing, validation, and overall, for the proposed model.
Figure 3. Regression graph for hidden neurons number of the proposed model for training, testing, validation, and overall
Table 2. The regression value of training, testing, validation, and overall, for the proposed model
|
ANN |
Correlation Coefficient (R) |
|
Training |
0.92 |
|
Testing |
0.93 |
|
Validation |
0.99 |
|
Overall |
0.94 |
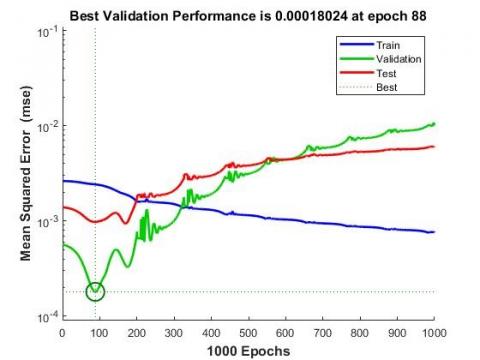
Figure 4 shows the gradient, validation check, and learning rate at epoch 1000. The gradient value at epoch 1000 is 0.0029944. In addition, validation inspections at the time of 1000 are 912, and the learning rate at epoch 1000 is 2.8797. Figure 5 shows the best validation performance of the proposed model. Figure 5 shows no significant training issues. The test curves and validation are too similar. If the test curve had considerably increased before the validation curve increased, some overfitting could have taken place. Normally, the error will decrease after more training cycles, but the validation data set may begin to increase when the network starts to override the training data. When set-up by default, the training ends after 100 consecutive validation errors, and the best performance is taken from the era with the lowest validation error.
Figure 4. The gradient, validation checks, and learning rate at epoch 1000
Figure 5. Best validation performance of the proposed model
After the network has been configured to maximize the network performance, it is important to change network parameters (called weights and partialities). This tuning is known as network instruction. The need for configuration and training is to provide the network with example data. The section discusses how the data can be loaded into the presentation network. It also clarifies the network set-up and the two network training types: incremental training and batch training.
The result of this study showed that ANN is an accurate model for predicting nitrate as a WQP in the Feitsui reservoir. The result of this study is supporting the findings of previous studies that mentioned in the literature review. According to Kadam et al. [10], ANN model predictions are reasonable and confirm consistently acceptable performance during pre- and post-monsoon seasons. Furthermore, according to the result of Stamenković et al. [11], ANN was a reliable model to predict the nitrate concentration. Moreover, the result of Zhang et al. [12] indicated that the HANN model was accurate for forecasting variations in water supply, suggesting that the HANN model could serve as a general guide for policymakers and DWTP managers to prepare regulatory adjustments, variations in the source water quality and consumer demand in advance. In addition, the result of Darwishe et al. [13] shows the potential of ANN modeling of spatially distributed hydrogeological data for nitrate pollution management at groundwater. It can therefore be inferred that prior field studies accompanied the findings of this research.
In this research, a model is developed for predicting the concentration of NO3 in the water of the Feitsui reservoir, Taiwan, based on the ANN method. The three-layer feed-forward neural network is the most used among various types of artificial neural networks. The LMA algorithm is used to correct shortcomings for the traditional BP algorithm as a slow converge and easy to achieve extreme minimum value for its faster convergence rates and lower error rates. The number of neurons in 1-20 neurons is distinct. Seventeen neurons were selected based on the minimum MSE of the exercise data set as the best number of neurons. The susceptibility analysis revealed that the studied nitrate effect of all ammonia (NH3) particles, nitrogen dioxide (NO2), dissolved oxygen (DO), and phosphate (PO4) inputs. In fact, with 25% of relative importance, NO3 is the most critical parameter. The result showed that ANN is an accurate model for predicting nitrate as a water quality parameter in the Feitsui reservoir. The regression value for the training, testing, validation, and overall are 0.92, 0.93, 0.99, and 0.94, respectively. It is suggested that the performance for representative ANN models with different parameter combinations and different network settings in predicting water quality parameters should be studied in future research.
Writing – original draft, Sarmad Dashti Latif; Formal analysis, Muhammad Shukri Bin Nor Azmi; Data Acquisition, Chow Ming Fai; Methodology, Ali Najah Ahmed; Supervision, Ahmed El-Shafie.
The authors would like to appreciate the financial support received from 2020106TELCO grant by the Innovation & Research Management Center (iRMC), Universiti Tenaga Nasional (UNITEN), Malaysia.
|
ANN |
artificial neural network |
|
NO3 |
nitrate |
|
WQP |
water quality parameter |
|
NH3 |
ammonium |
|
NO2 |
nitrogen dioxide |
|
DO |
dissolved oxygen |
|
PO4 |
phosphate |
|
R |
correlation coefficient |
|
COD |
chemical oxygen demand |
|
BOD |
biological oxygen demand |
|
SS |
suspended solids |
|
NO3-N |
nitrate-nitrogen |
|
TS |
total solids |
|
K+ |
potassium |
|
Cl- |
chloride |
|
Na+ |
sodium |
|
GA |
genetic algorithm |
|
ACOR |
ant colony optimization for continuous domains |
|
DE |
differential evolution |
|
ANFIS |
adaptive neuro-fuzzy inference system |
|
EC |
electrical conductivity |
|
SAR |
sodium absorption ratio |
|
TH |
total hardness |
|
RMSE |
root mean square error |
|
MAPE |
mean absolute percentage error |
|
MLR |
multiple linear regression |
|
HANN |
hybrid artificial neural network |
|
DWTPs |
drinking water treatment plant |
|
GIS |
geographic information system |
[1] Tyagi, S., Sharma, B., Singh, P., Dobhal, R. (2014). Water quality assessment in terms of water quality index. American Journal of Water Resources, 1(3): 34-38. https://doi.org/10.12691/ajwr-1-3-3
[2] Bozorg-Haddad, O., Soleimani, S., Loáiciga, H.A. (2017). Modeling water-quality parameters using genetic algorithm-least squares support vector regression and genetic programming. Journal of Environmental Engineering, 143(7). https://doi.org/10.1061/(ASCE)EE.1943-7870.0001217
[3] John, V., Jain, P., Rahate, M., Labhasetwar, P. (2014). Assessment of deterioration in water quality from source to household storage in semi-urban settings of developing countries. Environmental Monitoring and Assessment, 186: 25-734. https://doi.org/10.1007/s10661-013-3412-z
[4] Kazi, T.G., Arain, M.B., Jamali, M.K., Jalbani, N., Afridi, H.I., Sarfraz, R.A., Baig, J.A., Shah, A.Q. (2009). Assessment of water quality of polluted lake using multivariate statistical techniques: A case study. Ecotoxicology and Environmental Safety, 72(2): 301-309. https://doi.org/10.1016/j.ecoenv.2008.02.024
[5] Behmel, S., Damour, M., Ludwig, R., Rodriguez, M.J. (2016). Water quality monitoring strategies — a review and future perspectives. Science of The Total Environment, 571: 1312-1329. https://doi.org/10.1016/j.scitotenv.2016.06.235
[6] Gorashi, F., Abdullah, A. (2012). Prediction of water quality index using back propagation network algorithm. Case study: Gombak River. Journal of Engineering Science and Technology, 7(4): 447-461.
[7] Xing, Z.X., Fu, Q., Liu, D. (2011). Water quality evaluation by the fuzzy comprehensive evaluation based on EW method. In Proceedings - 2011 8th International Conference on Fuzzy Systems and Knowledge Discovery, Shanghai, China. https://doi.org/10.1109/FSKD.2011.6019494
[8] Sahaya Vasant, S., Adish Kum, S. (2019). Application of artificial neural network techniques for predicting the water quality index in the Parakai Lake, Tamil Nadu, India. Applied Ecology and Environmental Research, 17(2): 1947-1958. https://doi.org/10.15666/aeer/1702_19471958
[9] Azad, A., Karami, H., Farzin, S., Saeedian, A., Kashi, H., Sayyahi, F. (2018). Prediction of water quality parameters using anfis optimized by intelligence algorithms (Case Study: Gorganrood River). KSCE Journal of Civil Engineering, 22: 2206-2213. https://doi.org/10.1007/s12205-017-1703-6
[10] Kadam, A.K., Wagh, V.M., Muley, A.A., Umrikar, B.N., Sankhua, R.N. (2019). Prediction of water quality index using artificial neural network and multiple linear regression modelling approach in Shivganga River Basin, India. Modeling Earth Systems and Environment, 5: 951-962. https://doi.org/10.1007/s40808-019-00581-3
[11] Stamenković, L.J., Mrazovac Kurilić, S., Presburger Ulniković, V. (2020). Prediction of nitrate concentration in danube river water by using artificial neural networks. Water Supply, 1-14. https://doi.org/10.2166/ws.2020.104
[12] Zhang, Y., Gao, X., Smith, K., Inial, G., Liu, S., Conil, L.B., Pan, B. (2019). Integrating water quality and operation into prediction of water production in drinking water treatment plants by genetic algorithm enhanced artificial neural network. Water Research, 164: 114888. https://doi.org/10.1016/j.watres.2019.114888
[13] Darwishe, H., El Khattabi, J., Chaaban, F., Louche, B., Masson, E., Carlier, E. (2017). Prediction and control of nitrate concentrations in groundwater by implementing a model based on GIS and artificial neural networks (ANN). Environmental Earth Sciences, 76: 649. https://doi.org/10.1007/s12665-017-6990-1
[14] Kuo, J.T., Liu, W.C., Lin, R.T., Lung, W.S., Yang, M.D., Yang, C.P., Chu, S.C. (2003). Water quality modeling for the feitsui reservoir in Northern Taiwan. JAWRA Journal of the American Water Resources Association, 39(3). https://doi.org/10.1111/j.1752-1688.2003.tb03684.x
[15] McCulloch, W.S., Pitts, W. (1943). A logical calculus of the ideas immanent in nervous activity. The Bulletin of Mathematical Biophysics, 5: 115-133. https://doi.org/10.1007/BF02478259
[16] Haykin, S. (1999). Neural networks: A comprehensive foundation by Simon Haykin. The Knowledge Engineering Review. Published online by Cambridge University Press, 13(4): 409-412. https://doi.org/10.1017/S0269888998214044
[17] Mirjalili, S. (2015). How effective is the grey wolf optimizer in training multi-layer perceptrons. Applied Intelligence, 43: 150-161. https://doi.org/10.1007/s10489-014-0645-7
[18] Faris, H., Aljarah, I., Mirjalili, S. (2016). Training feedforward neural networks using multi-verse optimizer for binary classification problems. Applied Intelligence, 45: 322-332. https://doi.org/10.1007/s10489-016-0767-1
[19] Aljarah, I., Faris, H., Mirjalili, S. (2018). Optimizing connection weights in neural networks using the whale optimization algorithm. Soft Computing, 22: 1-15. https://doi.org/10.1007/s00500-016-2442-1
[20] Aljarah, I., Faris, H., Mirjalili, S., Al-Madi, N., Sheta, A., Mafarja, M. (2019). Evolving neural networks using bird swarm algorithm for data classification and regression applications. Cluster Computing, 22: 1317-1345. https://doi.org/10.1007/s10586-019-02913-5
[21] Tikhamarine, Y., Souag-Gamane, D., Najah Ahmed, A., Kisi, O., El-Shafie, A. (2020). Improving artificial intelligence models accuracy for monthly streamflow forecasting using grey wolf optimization (GWO) algorithm. Journal of Hydrology, 582: 124435. https://doi.org/10.1016/j.jhydrol.2019.124435
[22] Jumin, E., Zaini, N., Ahmed, A.N., Abdullah, S., Ismail, M., Sherif, M., Sefelnasr, A., El-Shafie, A. (2020). Machine learning versus linear regression modelling approach for accurate ozone concentrations prediction. Engineering Applications of Computational Fluid Mechanics, 14(1): 713-725. https://doi.org/10.1080/19942060.2020.1758792
[23] Okafor, V.N., Obiadi, M.C., Obiefuna, J.N. (2020). Correlations of major flame characteristics of some fire tolerant trees in south-east nigeria by coefficient of determination (R2). Journal of Scientific Research and Reports, 26(4): 81-98. https://doi.org/10.9734/JSRR/2020/v26i430250
[24] Lai, V., Malek, M.A., Abdullah, S., Latif, S.D., Ahmed, A.N. (2020). Time-series prediction of sea level change in the east coast of Peninsular Malaysia from the supervised learning approach. International Journal of Design & Nature and Ecodynamics, 15(3): 409-415. https://doi.org/10.18280/ijdne.150314