Guglielmina Mutani* | Beltramino | Anna Forte
© 2020 IIETA. This article is published by IIETA and is licensed under the CC BY 4.0 license (http://creativecommons.org/licenses/by/4.0/).
OPEN ACCESS
The energy community is defined as a “cooperative/partnership/non-profit organization of final customers (municipalities, public and private entities, citizens) aimed at achieving energy independence in order to guarantee energy security, low environment impact and affordable energy costs”. This work defines a place-based methodology for the dimensioning of energy communities, according to the requirements of the first Italian law on energy communities issued by the Piedmont Region. The aim is to evaluate the correct size and optimal aggregation of municipalities for future energy communities, considering the energy consumptions and the renewable energy sources available in a territory. In particular, with a place-based methodology, the electricity potentially produced by forest and agricultural biomass, waste, wind, solar and hydraulic sources was evaluated, in accordance with regulations and constrains. Thus, a renewable energy sources atlas was implemented to provide a tool for the estimation of energy, environmental and socio-economic performance indexes of the municipalities of the Piedmont Region. In conclusion, considering the energy production, productivity and consumption of each municipality and the requirements of energy communities, a tool to optimally aggregate municipalities for creating energetic communities is described.
sustainable development, atlases and models, energy efficiency measures, renewable energy sources technologies, smart grids
In March 2010, the European Commission drafted a document, Europe 2020, in which it declared states' concerns about climate change and what could be the possible solutions for energy management. To this end, a climate action plan has been developed, where limits on greenhouse gas (GHG) emissions have been set to achieve a sustainable economy by 2050: the limitations on GHG emissions are fundamental to counteract the global warming on the Earth.
In November 2016 was proposed the Clean energy for all Europeans package consisting of eight legislative acts to achieve the goals set by the Paris Agreement. The new rules will bring considerable benefits from a consumer perspective, from an environmental and an economic point of view.
The EU has set an ambitious, binding target of 32% for renewable energy sources in the EU’s energy mix by 2030. At the same time, the rights to self-production of energy, self-consumption, storage, and sale at market price are recognized for individuals and communities, with a fundamental role in the future European energy system.
The European Renewable Energy Directive (RED II) signed in December 2018, as part of the Clean Energy for all Europeans package, defines the “Renewable Energy Communities” (RECs) and introduces a governance model for them and the possibility of energy sharing within the REC.
The renewables directive focuses on the promotion of RE and thus speaks of “Renewable Energy Communities” (RECs), whereas the directive on the internal electricity market of the European Union as the more general legal act addresses “Citizen Energy Communities” (CECs). The purpose of RED II is to specifically support the deployment of renewable energy sources (RES) for low-carbon energy systems. Both directives expressly see the consumer “at the heart of the energy markets”.
The new RES Directive, for the first time, includes a definition of a ‘renewable energy community’. The text defines it as: a legal entity:
i) which, according to applicable national law, is based on open and voluntary participation, is autonomous, and is effectively controlled by shareholders or members that are located in the proximity of the renewable energy systems owned and developed by the community itself;
ii) whose shareholders or members are natural persons, local authorities, including municipalities, or SMEs;
iii) whose primary purpose is to provide environmental, economic, or social benefits for all its members or the local areas where it operates, rather than financial profits.
The EU Regulation 2018/1999 provides a structured and iterative process between the EU Commission and the Member States aimed at development and subsequent implementation of national plans to reach energy and climate targets with a long-term perspective. The Italian legislative context applies the international agreements with the Integrated National Plans for Energy and Climate2030 where the use of renewable energy sources is set as a priority objective by 2030.
Moreover, at national level the Italian Law 221/2015, art. 71 establishes and promotes the "Oil free zones", territorial areas in which the progressive replacement of oil and its derivatives with energies produced from renewable sources is expected. In these areas, experiments are launched, concerning the creation of new case studies where the energy can be a common good. To this end, local authorities, which have adhered to this protocol, must evaluate the energy resources present in their territory and monitor their consumption, in order to evaluate the energy consumption-production balance of the community. These entities undertake to collaborate in order to develop a plan to achieve energy self-sufficiency in the oil-free zone, or at least in some of its territories, verifying the feasibility conditions of energy communities in the territory itself.
Considering these new national and European policies, the Piedmont Region has approved the first regional law in Italy to encourage the constitution of new energy communities: regional law 12/2018 on the Promotion of the institution of energy communities. Different stakeholders can join the energy communities, such as public or private users, in the form of consortia or cooperatives to achieve energy self-sufficiency.
In summary, the regional law 12/2018 addresses four fundamental points for the establishment of energy communities:
And it is precisely on this last point that the work on the model of community sizing will refer.
1.1 Research gap
The main problem with energy development lies in the contradiction between the lack of energy resources and the growing energy demand for social progress. To solve the problem, it is necessary to develop new renewable and green energy sources that help mitigate the conflicts between society, economy and environment, paving the path towards an eco-friendly society [1, 2].
From the United Nations’ “Press Kit for the Sustainable Development Summit 2015 - Time for Global Action for People and Planet”, the sustainable development has been defined as development that meets the needs of the present without compromising the ability of future generations to meet their own needs. For sustainable development to be achieved, it is crucial to harmonize three core elements: economic growth, social inclusion and environmental protection. These elements are interconnected, and all are crucial for the well-being of individuals and societies [3].
Realizing a resource-efficient and sustainable energy economy is a current major challenge for worldwide society and chemical industry plays a key role to achieve this goal [4]. Moreover, the increasing awareness about climate change issues has considerably increased the international community attention towards Renewable Energy Sources (RES) [3].
Traditionally, centralization is the common approach to the energy supply. Due to the centralized approach, energy is guaranteed by power plants that produce energy later distributed to final users. The alternate approach is decentralized; and, in this context, Decentralized Energy Systems (DESs) have been recognized as an effective option to centralization [5].
Even though cities are often seen as net consumers of energy, there are several opportunities for local energy generation in urban areas. The integration of distributed generation in the urban territory entails that energy users will not be merely passive consumers, instead they switch between consumers and local energy producers. In the matter in question, the decentralization of the energy generation also impacts on the urban planning and, therefore, pushes towards the definition of proper energy planning models centered on the installation of energy efficient systems in urban areas [6]. Moreover, being cities characterized by two-third of the global energy demand, the need to produce energy in a more responsive way is becoming even more urgent. In addition, renewable energy is characterised by limited availability over time and generation discontinuity; therefore, it should be coupled to a stable and programmable energy source [7] or be supported through storage systems.
With the energy planning and its tools and atlas, it is possible to combine urban transformations with sustainable development, intervening with targeted effective policies that take into consideration the different aspects of the territories.
1.2 Research objectives
This study describes models to evaluate energy consumption and renewable energy production on a regional scale and presents the case study related to the Piedmont Region. The purpose of this work is present a place-based renewable energy tool for the evaluation of the optimal size of the energy communities.
In this work a Geographic Information System (GIS) tool was used for the creation of an energy atlas, to collect, manage and organize energy-related data in order to evaluate the relative strengths and weaknesses of the territories [8]. GIS tools can also be used to create atlases at different scales where data can be represented with a spatial distribution on maps through various indicators, such as the uncovered demand, self-consumption or over production but also types of users and the characteristics of the built environment [9].
The developed model uses existing geographical databases such as municipal and regional technical maps, is easy to use and allows the analyses to be adapted to the context studied; indeed, it ensures a high degree of transparency, reproducibility and adaptability [10]. The availability of accurate data and their level of detail and aggregation play a fundamental role in the implementation and calibration of energy models [11, 12].
The methodology presented is based on the use of Territorial Information Systems (SIT), tools that allow the collection, the processing, and the representation of geo-referenced data of different energy-related variables at different scales. It is possible to develop pre-feasibility studies by processing data and information with the GIS software that allow to calculate the energy demand, the produced energy and the potentially energy producible on a territory, in accordance with the regional regulations and various constrains. In this work, it was possible to evaluate the produced energy and the potentially energy producible with the following renewable sources: forest biomass, agricultural biomass, waste biomass, wind, solar and hydraulic energy.
This methodology is thought to compare the energy that can be produced with the energy demand in order to be able to evaluate the energy security and the energy independence level of a territory with its environmental impact. This methodology allows to consider the constraints on the territory, which could limit the energy production with the available renewable energy sources.
2.1 Energy models at territorial scale
This chapter reports a top-down energy model based on GIS tool that has been used to predict possible future energy scenarios, considering different energy solutions. In this work the electrical consumption of the buildings was evaluated considering the residential, tertiary, municipal, industrial and agricultural sectors. The information was collected and geo-referenced through a GIS system and then compared with all the constraints presented in the area.
The energy consumptions for each municipality was elaborated by the Piedmont Region for the reference year 2016 [13]. The database was elaborated through the data obtained by the main supplier companies operating in the Piedmont Region. The main distributor of electric energy is Enel Spa, which supplies a total of 1204 municipalities and 99.83% of the market, with exception of Turin and Vercelli, respectively supplied by IReti Spa and Atena Spa. In addition, there are 8 municipalities served simultaneously by Enel Spa and Municpal Electricity Companies (A.E.M. in Chiomonte, Exilles, Novalesa, Ronco Canavese, Salbeltrand, Valprato Soana; Impresa Produzione Energia Elettrica di Pesenti F. e C. S.N.C. in Crodo; Società Elettrica la Bruzolese S.R.L in Bruzolo), having their own production plants (e.g. the hydroelectric power plant of Chiomonte).
As far as it concerns the database, the electricity consumption data were available for the years from 2010 to 2017, expressed in kWh and divided into the different sectors (Residential, Civil non-residential, Tertiary, Industrial and Agricultural).
Therefore, the energy consumption data were represented for the Piedmont Region. Then, different models could be applied to evaluate the energy efficiency measures to reduce consumptions and GHG emissions; this audit methodology is described by standards. According to UNI CEI EN 16247 and UNI/TR 11775 for buildings, the energy audit analysis can be described with the following steps:
In this work, the main energy-related variables available at territorial scale were identified from regional and national databases; correlation values for each energy-use sector were identified at municipal scale.
The annual energy production model has been elaborated at municipal level according to the RES technology used. In this work, only RES technologies were investigated as one of the main objectives of the energy communities is the low environmental impact of human activities with low-carbon systems. From the updated national database of Atlaimpianti by GSE (Energy Services Management, Gestione Servizi Energetici in Italian) and, the number of RES technological systems and their power was obtained for each municipality.
In Table 1, the installed power of RES systems in Piedmont Region are reported per type of RES. It is possible to observe that hydroelectric and solar photovoltaic (PV) systems are the main technologies used to produce electrical energy due to the high presence of: rivers, mountains and population (on whose dwelling/building, photovoltaic panels can be installed). The most widespread renewable production plants in the Region are PVs (only 3.32% of the municipalities do not have PV).
As far as it concerns the PV systems, in 2019 52.890 PV plants were installed in 1165 municipalities, for a total power of approximately 1.5 GW. Generally, the average value of the installed power is equal to 27.95 kW, whereas the median value corresponds to 4.5 kW; thus, most of the plants of medium-small size, most likely to supply the electric energy to private dwellings. Regarding larger PV plants, about 10% of the plants have a nominal power of more than 20 kW and only 1.75% of the systems installed is classified between 200 kW and 1 MW, which contributes to the production of 2.79% of the installed power.
With regard to hydroelectric plants, the Piedmont Region has registered 746 plants in 2019, for a total power of 1.703 MW. The average power value of these plants is 2.2 MW, while the median is about 0.5 MW. Most of them (95%) have a power less than 5 MW, and the 52% less than 500 kW; thus, the majority are plants of medium-small size. Plants with a power greater than 10 MV are only about 3%, which however correspond to 64.61% of the installed power.
The production of energy from renewable sources can vary considerably by the type of RES technology and changing weather and climate conditions. Therefore, for its potential evaluation, average values on the last years should be used. Then, considering the average utilization hours uh and the power installed, the annual energy production can be estimated. The utilization hours of the different types of RES systems were obtained from Italian statistical reports on renewable sources edited by GSE. Since Italy is a country with very different territories and that develops from latitudes of 36 °N to 46 °N, in Table 2, the average Italian value and the data for the Piedmont Region were reported. For the Piedmont Region, the utilization hours for hydroelectric are higher than the national average, while they are lower for the solar PV and wind technologies. For biomass plants the values can vary greatly: wooden biomass cogeneration plants can exceed 7500 hours.
Table 1. Power of main RES systems/plants installed in Piedmont Region at 2019 [18]
|
2019 |
Hydro |
Wind |
Solar PV |
Biomass |
Bio-gas |
|
MW |
170.2 |
18.8 |
1478.3 |
127.5 |
159.9 |
Table 2. Annual utilization hours uh of RES systems/plants
|
uh [18, 19] |
Hydro |
Wind |
Solar PV |
Biomass |
Bio-gas |
|
Italy (2014-18) |
2479 |
1802 |
1197 |
7519 |
|
|
Italy (2018) |
2576 |
1795 |
1141 |
7509 |
|
|
Piedmont (2018) |
2871 |
1578 |
1072 |
4830-7500 |
|
In order to assess the technical, economic and environmental feasibility of energy communities, a tool will be used to optimise the aggregation of several municipalities considering their consumption, production and potential energy productivity utilizing the following indicators: covered and un-covered energy demand and over-production.
The Piedmont Region is located in the North-West of Italy and borders France to the West and Switzerland to the North. It has a very large territory (it is the second largest Italian region in terms of surface area) and is different from the Po Valley to the Alps and Apennines mountains, with many rivers and lakes and with a big capital Turin with just under 900,000 inhabitants and a density of 6,737 inh/km2. Precisely because of its very varied territorial characteristics, it has a very varied availability of renewable energy sources with the exception of wind because it is a region surrounded by Apennine and Alps mountains from south-west to north. Besides, it has a population of 4.36 M of inhabitants living mainly in the plains, particularly in and near Turin, where industrial activity is concentrated. There are many industries: the main one is FIAT, which manufactures cars and planes, but also textile and mechanical industries. This high concentration of human activity, it means large amounts of energy consumptions.
In Table 3, the territorial databases used for the evaluation of energy consumptions, production and productivity are reported.
Table 3. Place-based databases used on a regional scale for the Piedmont Region
|
Data |
Source |
|
Digital Elevation Model (DEM) (10m) |
Piedmont Geoportal |
|
National Technical |
Piedmont Geoportal |
|
Wooded surface area covers |
SIFOR Regional Forest Information System |
|
Roadmap |
Piedmont Geoportal |
|
Existing and proposed forest road |
Sistema Piemonte |
|
Land Cover: Classification of land use |
Piedmont Geoportal |
|
Production of urban waste per capita |
ISPRA Waste Observatory |
|
Waste usable fraction |
Urban Waste Report of the ISPRA |
|
Wind resource |
ECMWF meteorological institute of Reading |
|
Pick-up and return points canal |
SIBI-web Piedmont Region |
|
Energy consumptions |
Piedmont Regional database |
|
Population, buildings, industrial and socio-economic data (2011) |
ISTAT – Italian National Institute of Statistics |
|
Weather data |
ARPA Piemonte |
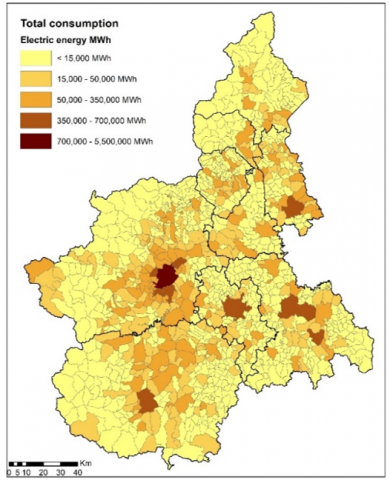
The electrical consumptions of the Municipalities of the Piedmont Region were analysed for the following sectors: residential, civil non-residential, tertiary, industry and agriculture. Figure 1 represents the global electrical consumption of the municipalities. The high consumption of the provincial capitals of Torino, Novara, Alessandria, Asti, Cuneo, Biella, Verbania, Vercelli can be observed. The consumption of an average inhabitant is 1,043 kWh/inh (median value: 1,417 kWh/year); families of 2.2 people/fam have an average consumption of 2,880 kWh/fam (median value: 2,325 kWh/fam). Finally, the breakdown of consumption between sectors is residential 15%, civil non-residential 30%, tertiary 21%, industry 33%, agriculture 1%.
Correlations of the energy consumptions with the main energy-related variables were obtained for each sector. The Pearson correlations were used to determine the level of relationship between a variable and energy consumptions at municipal scale.82 variables were taken into consideration in this analysis and were derived mainly from the ISTAT Census 2011 (e.g. number of inhabitants, income and characteristics of buildings and companies) and weather-geographical data.
In Table 4 can be observed the strong correlation between the number of inhabitants or families and the electric consumption, as well as the number of employees in companies and public buildings. The most unsatisfactory results concern the agricultural sector, as the demand for electricity in this sector is only related to the municipal area of plain zones without considering the more populous cities of Turin and Novara.
Figure 1. Electric energy consumptions in the municipalities of the Piedmont Region
Table 4. The main energy-related variables and correlations
|
Sector |
Inhabit. |
Dwelling surface |
Building used |
Industrial and commercial buildings |
Company employees |
Number of public bodies |
Municipal. plain area (km2)* |
|
Residential |
99.9% |
99.8% |
93.8% |
99.0% |
99.7% |
96.3% |
64.3% |
|
Civil non-Res |
94.9% |
93.7% |
85.6% |
83.4% |
91.8% |
86.3% |
53.7% |
|
Tertiary |
88.6% |
88.7% |
90.9% |
87.5% |
87.3% |
91.3% |
49.3% |
|
Industrial |
94.0% |
93.9% |
89.0% |
93.2% |
94.1% |
90.8% |
42.5% |
|
Agricultural |
14.5% |
14.8% |
27.3% |
15.9% |
13.0% |
21.9% |
73.8% |
|
Global |
94.1% |
94.2% |
95.4% |
93.2% |
93.3% |
95.3% |
56.8% |
3.2 RES production models
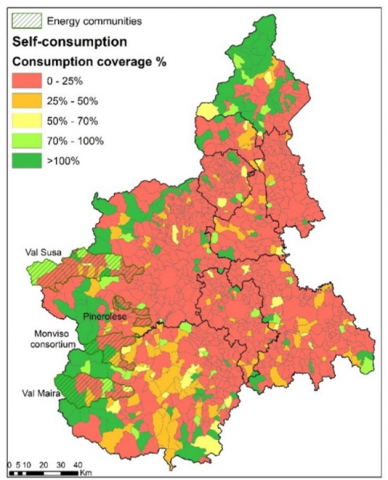
The annual energy production model was elaborated with a place-based tool knowing the type of RES technology used, the installed power and the utilization hours. The Figure 2 shows the self-consumptions (SC), that in this work was defined as the ratio between energy production and consumption: SC=P/C (no other data were available).
It can be observed that only a small part of energy consumption can be supplied with RES and that the highest values of self-consumption are concentrated in mountain areas due to a lower consumption and a higher production.
Figure 2. Self-consumption in the municipalities of the Piedmont Region (SC=P/C)
With regard to the spatial distribution of the total production of electricity from renewable sources, it is clear from Figure 2 that most of the production is concentrated mainly in the province of Verbano-Cusio-Ossola (in the northern part), followed by the province of Cuneo (in the southern part). Both of them are in fact characterized by mountain territories scarcely populated with greater production opportunities to develop, for instance, hydroelectric and biomass plants.
At the beginning of 2020, four energy communities were proposed at the Piedmont Region for the call D.D. 547/2019): Pinerolese (with 6 municipalities), Val Maira (with 13 municipalities), Val Susa (with 22+9 municipalities), and Monviso Consortium (with 10 municipalities). These energy communities are represented in Figure 2 with dashed lines.
3.3 RES productivity models
Although the regional territory is very varied and rich in resources, in order to achieve energy independence, it is necessary to further exploit the available energy resources locally, respecting the constraints of the territory. The analysis presented in this work goes in this direction, because it allows to aggregate territories with public and private realities that have different characteristics in order to diversify energy sources with the aim of achieving energy independence.
In this paragraph, a feasibility place-based study is presented which could be used to highlight the potential and limitations of a territory for the exploitation of renewable energy sources. This analysis starts from an evaluation of the availability and accessibility of energy resources, and then verifies the presence of technical, environmental or legislative/regulatory constraints that could limit their exploitation. In these spatial analyses, to obtain accurate results some reasonable approximations were assumed because the amount of data to be processed is enormous and the calculation time should not be too long.
This feasibility study considers the following RES systems/plants: solar photovoltaic integrated on the roofs of buildings, forest and agricultural biomass, waste-to-energy, hydroelectric and wind power.
3.3.1 Solar analysis
A pre-feasibility analysis related to photovoltaic panel integrated on the roofs of the buildings of the Piedmont Region is presented, considering the geo-morphological characteristics of the territory, sun obstructions and type of sky. This analysis is developed according to the following points:
1. Calculation of the monthly solar radiation incident on the territory. The national Digital Elevation Model (DEM) with an accuracy of 10 m was used. A much more accurate analysis can be done with the Digital Surface Model (DSM) at 5 m in order to have the exact solar radiation affecting the roofs, taking into account the orientation and inclination of the roof pitches. However, this simulation can be done for small areas and lasts much longer; in addition, the database management becomes much more critical. This analysis was performed with “area solar radiation” tool of GIS considering the season characteristics of sun (with the percentage of diffuse component d) and sky (with the atmosphere transmissivity t) reported in Table 5 for the different 8 provinces and for the Metropolitan City of Turin “TO” (i.e. AL, AT, BI, CN, NO, TO, VB, VC).
2. Calculation of solar radiation on the roofs of buildings. Using the National Technical Map, it was possible to identify the buildings footprint and therefore the seasonal and annual solar radiation that affects every roof of the buildings in the region was analyzed. In this work it was assumed that only the 20% of roofs is better exposed to solar radiation and is available for the installation of photovoltaic panels. This methodology consents to make distinctions on the type of: building, roof, area (e.g. in historical centers) or objects on the roof, that limit its use.
Table 5. Solar irradiation diffuse percentage d and sky transmissivity t
|
Winter |
Spring/Autumn |
Summer |
||||
|
d [%] |
t [%] |
d [%] |
t [%] |
d [%] |
t [%] |
|
|
AL |
57 |
52 |
42 |
66 |
38 |
72 |
|
AT |
50 |
53 |
37 |
67 |
36 |
73 |
|
BI |
55 |
55 |
46 |
66 |
40 |
72 |
|
CN |
42 |
57 |
40 |
66 |
40 |
71 |
|
NO |
54 |
53 |
46 |
66 |
40 |
72 |
|
TO |
54 |
54 |
43 |
65 |
37 |
72 |
|
VB |
44 |
54 |
41 |
66 |
40 |
70 |
|
VC |
53 |
53 |
44 |
64 |
39 |
72 |
E = PR. Hs. S.η (1)
where, E is the electrical energy produced by year (kWh/a), S is the surface of the PV panel (m2) and Hs is the cumulative annual solar radiation (kWh/m2/a).
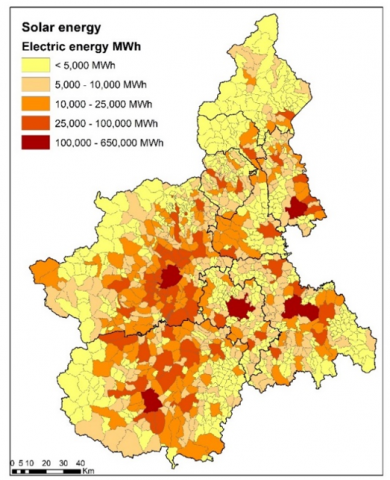
Figure 3. Electrical energy availability from PV with roof integrated technologies on residential buildings
The results are shown in Figure 3; these results, which have been calculated considering only residential building in the region is aggregated for municipality. The sum of the values at the regional level has a residential share of 10.144.737 MWh (72.5%), and industrial-commercial share of 3,850,583 MWh (27.5%). For this analysis, only solar roof integrated technologies on residential buildings were considered so as not to incur territorial constraints.
3.3.2 Forest and agricultural biomass analysis
The analysis for the exploitation of forest and agricultural biomass to produce energy is developed according to the following points:
(1): Calculation of the availability of biomass. Based on the Regional SIFOR database (Regional Forestry Information System and "Land Cover Piedmont: Classification of land use 2010"), the wooded and agricultural surface area were evaluated. The wooded area covers ≈874.660 ha of the region's surface with a woodland index of 34.4%, and ≈298.470 ha with agricultural fields index of 11,7%.
(2): Calculation of accessible biomass areas. The biomass must be accessible in order to be used; it is therefore necessary that the transport can reach the areas of interest, including the forest paths (the roadmap of the Piedmont Geoportal, the existing and proposed forest road system provided by Sistemapiemonte). The width of the accessible area around the roads also depends on the slope of the terrain. From this analysis it was found that the accessible wood area is reduced to 748.408 ha with an accessibility index of 29.4%.
(3): Calculation of the electrical energy that can be produced from forest biomass. The evaluation of the energy that can be produced by a biomass plant considers: the accessible area for each plant, the amount of biomass that can be taken annually to produce energy (taking into account the growth rate of the plants), the lower calorific value of plants and the electrical energy conversion efficiency of a standard biomass plant of 18-25%. These data were elaborated in a regional inventory in previous studies [15-17] and can be found in Table 6; the results are shown in Figure 4.
Figure 4. Biomass energy availability (types of forest and agricultural crops)
Table 6. Annual specific productivity P (for the Piedmont Region) and lower calorific value of the dry biomass [15]
|
COD |
Forestry category |
Density kg/m3 |
Productivity p t/ha/y |
LCV kWh/kg |
|
AB |
Fir wood |
450 |
2.38 |
5 |
|
AF |
Maple, linden, ash |
650 |
0.36 |
4.1 |
|
AN |
Alnets |
620 |
1.39 |
4.1 |
|
AS |
Shrub woods |
525 |
0.02 |
4.1 |
|
OV |
Shrubbery (subalpine) |
500 |
0.00 |
4.1 |
|
BS |
Invasive woods |
500 |
0.14 |
4.0 |
|
CA |
Chestnut |
540 |
3.23 |
4.0 |
|
CE |
Turkey Oak |
900 |
1.42 |
4.0 |
|
FA |
Beech Wood |
730 |
1.13 |
4.0 |
|
LC |
Larch Wood |
650 |
0.49 |
4.3 |
|
OS |
Manna Wood |
550 |
1.07 |
4.1 |
|
PE |
Norway Spruce |
450 |
0.76 |
4.5 |
|
PM |
Maritime Pine |
450 |
0.43 |
4.4 |
|
PN |
Mountain Pine |
560 |
0.04 |
4.4 |
|
PS |
Scots Pine |
540 |
1.78 |
4.4 |
|
QV |
Sessile Oak |
760 |
0.66 |
4.2 |
|
QR |
Downy Oak |
760 |
0.60 |
4.2 |
|
QC |
Hornbeam |
800 |
0.64 |
4.2 |
|
RI |
Reforestation |
500 |
2.03 |
4 |
|
RB |
Black Locust (Robinia) |
760 |
0.98 |
4.5 |
|
SP |
Riparian willows and poplar |
650 |
1.48 |
4.0 |
|
COD |
Agricultural category |
p t/ha/y |
Useful fraction % |
LCV kWh/kg |
|
PR |
Rice straw |
2.87 |
60% |
2.36 |
|
LR |
Rice husk |
6.54 |
12% |
4.00 |
|
PC |
Cereal straw |
2.18 |
40% |
2.36 |
|
TV |
Vine branch |
1.45 |
30% |
2.20 |
|
VR |
Marc and stalks |
7.05 |
8% |
2.20 |
|
PF |
Poteture of orchards |
2.20 |
90% |
3.40 |
|
PP |
Poplars |
12.0 |
15% |
2.20 |
|
AI |
Unsorted arboriculture |
17.6 |
50% |
2.20 |
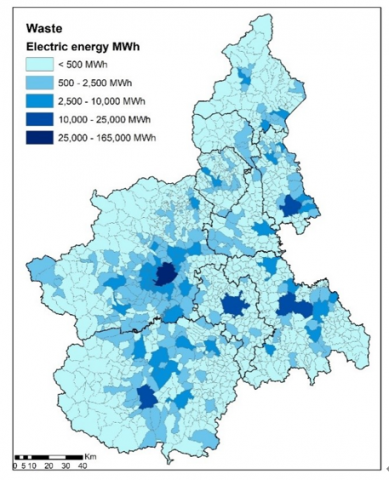
The analysis on the use of waste for energy purposes in the Piedmont region is developed considering:
1. Calculation of the quantity of waste produced on the territory. To quantify waste at municipal level, the "Total production of urban waste per capita by municipality" as of 2017 provided by the ISPRA Waste Observatory with a total of 2,080,295 t/year for the Piedmont Region.
2. Calculation of the amount of waste that can be used to produce energy. The quantities of waste produced are divided into categories and for each category the "usable fraction" (Urban Waste Report of the ISPRA Waste Service) is identified and reported in Table 7.
Table 7. Characteristics of municipal solid waste produced in Italy estimated by ISPRA & Lower Calorific Value [18]
|
Component |
Content % |
Renewability % |
Useful fraction % |
LCV kWh/kg |
|
Organic |
34.4 |
100 |
34.4 |
1.83 |
|
Paper |
22.8 |
100 |
22.8 |
4.22 |
|
Plastic |
11.6 |
0 |
0 |
11.31 |
|
Metals |
4.3 |
0 |
0 |
- |
|
Glass |
7.6 |
0 |
0 |
- |
|
Wood |
3.8 |
100 |
3.8 |
4.64 |
|
Electronic c |
2.4 |
0 |
0 |
0.67 |
|
Textile |
5.1 |
50 |
2.5 |
3.75 |
|
Others |
5.5 |
10 |
0.5 |
1.67 |
|
Total |
100 |
- |
64 |
- |
The results are shown in Figure 5.
Figure 5. Waste-to-energy availability
3.3.4 Hydroelectric energy analysis
Hydroelectricity is the main renewable resource in the Piedmont Region.
The analysis of the feasibility of this resource is carried out calculating potential energy of water that flows from a higher to a lower elevation according to the following points:
(1): Calculation of the altitude of the pick-up and drop-off points, using the digital terrain model DTM at 10 m that allows to evaluate the slope of the terrain. Considering two points on the slope, the water head H and the water flow Q was computed for each river and canals.
(2): Calculation of the energy E produced annually:
E = 9.81. H. Q. η (2)
where, η is the conversion efficiency of a hydroelectric plant (80% [19]).
From the analysis conducted so far, it appears that the Piedmont Region is saturated with sites suitable for the installation of large plants on rivers. So, the calculation of the hydroelectric potential has focused on the energy that can be produced from the reuse of existing irrigation canals, which are still underutilized.
(3): Calculation of the availability of potential present on the territory. Given the theoretical powers and the irrigated areas present on each agricultural consortium, the specific power was calculated. The results are shown in Figure 6.
In Piedmont Region the average utilization value of the irrigation canals is between 16.5% and 22.2% (for the specific power category 0-0.5 kW/ha); an analysis of the utilization coefficient of the irrigation system revealed that this value reached a maximum of 19% [20], therefore this value has been assumed in this work.
In Piedmont, for example, the residual hydroelectric potential of the irrigation system could be exploited by reusing the old abandoned canals or aqueducts with mini-micro plants. These solutions reduce also the cost of civil works and have a very low environmental impact.
Figure 6. Hydroelectric energy availability from existing irrigation channels
3.3.5 Wind energy analysis
The Piedmont Region is surrounded from South-West to North by mountains and therefore is not suitable to exploit the wind speed to produce energy. However, starting from the analysis on the use of the wind source can be developed according to the following points:
(1): Calculation of the amount of wind on the territory. The wind speed data have been simulated, known the data available at various heights from the Italian Wind Atlas and the ECMWF meteorological institute of Reading.
(2): Calculation of energy productivity, taking into account the space required for the various wind turbines and the areas not suitable for the installation of this technology. The installation of systems considers the assessing constraints (which are reported in the following chapter) and the distance from the houses, which must be at least of 200 m, as reported in D.M. 10.09.2010 “Guidelines for the authorization of renewable energy plants”. Given the productivity of wind energy and the areas which are not appropriate for these types of systems, it is possible to compute the energy produced by the wind turbines.
In this work, the potential productivity was evaluated considering the installation of wind turbines with rotor hub height of 25 m, with a power of 55 kW and rotor diameter 19 meters [21]; any other hypothesis could be valid, for example, with smaller installations close to population centres. This technology is conventionally used in current wind-farm implementations with an optimal average turbine spacing of 7 times the diameter of the rotor [22]. The area occupied by a wind turbine of this size is about 13,000 m2. Currently, a conversion efficiency of 40% can be assumed [23]. The results of this hypothesis are shown in Figure 7.
Figure 7. Wind energy availability
3.4 Constrains analysis in Piedmont
In Piedmont, the main constraints for the installation of plants for the production of electricity from RES are the regional resolutions: D.G.R. 3-1183/2010 and D.G.R. 53314/2012. The areas where electricity cannot be produced can be summarized in the following four categories:
The total electricity consumption in Piedmont, elaborated with a monitoring campaign for the year 2017, considers electricity for: civil, tertiary, industry and agriculture sectors.
These consumptions have been compared with the productions of energy from RES in the territory in order to understand where the Piedmont Region is in relation to the objectives of the Clean Energy for all Europeans package. The aim of this work is to achieve the energy independence through the union of energy producers, distributors and consumers with the energy communities.
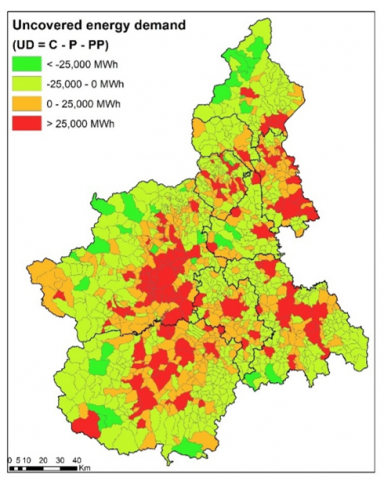
Then, energy consumption (C) has been compared with RES production (P) in order to assess the uncovered demand (UD = C-P) or the overproduction (OP = P-C).
Before moving to the aggregation of municipalities with energy communities, efforts were made to further exploit the RES available on the territory by adding potential productivity (PP). Therefore, the uncovered demand will be calculated with:
UD = C – P - PP. (3)
Figure 8. Uncovered energy demand with the potential productivity (UD = C – P – PP).
Figure 9. Self-consumption with the potential productivity SC = (P+PP)/C
The Figure 8 is represented also the new uncovered demand. Energy intensive areas have a very high share of UD and therefore, in order to achieve energy independence, they have to aggregate with more virtuous territories.
The Figure 9 shows the self-consumptions, that is the ratio between energy production plus productivity and consumption: (P+PP)/C. This map shows big differences in self-consumptions between municipalities, underlining the importance of aggregation and sizing in areas to achieve the sustainable development of territories.
The municipalities that exceed 100% of self-consumption are many; they correspond largely to the municipalities, that in Figure 1, have low energy consumption. The provincial capitals with high energy consumption are all below the 50% of self-consumption. It can be noted that around large cities the share of self-consumption is very low due to the high concentration of energy demand and the low availability of renewable sources. This is part of the concept of energy communities: in order to meet a high energy demand, a large territorial area is needed due to the dispersed nature of renewable energy sources and their discontinuity in generation.
In this work, the areas that will be used for the aggregation of municipalities into possible energy communities are the Areas of Territorial Integration (AIT) defined by the Regional Territorial Plan (PTR). The Piedmont Region is divided into 33 AIT: union of municipalities, close to a main urban centre, which constitute themselves as optimal areas to create shared development processes and strategies.
The basic requirement for energy communities has been identified in Regional Law 12/2018 and concerns a minimum self-consumption of 70%; moreover, at least half of this share must be covered by renewable sources. On the basis of this criterion the optimal unions of municipalities for the creation of an energy community will be identified.
Figure 10. Energy community hypothesis with AITs (the 4 energy communities are indicated with dashed areas)
Figure 11. Clean Energy Atlas tool: Future scenario for the “Pinerolese” energy community
In this work, regional AITs were first analysed to identify the optimal energy communities but then unions of smaller municipalities were investigated. This solution should allow an easier management of energy demand and supply options.
Figure 10 represents the self-consumption of the 33 AITs; as can be seen, the 70% threshold is met mainly where there are no large energy-consuming cities.
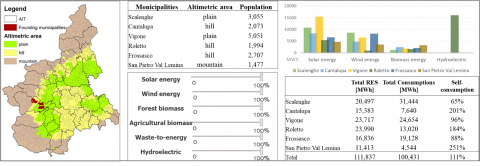
In April 19th 2019, in the Pinerolo area, the first oil free zone in Italy called "Sustainable Territory" was founded. This oil free zone is preliminary to the establishment of the Pinerolese energy community (EC). This territory is characterized by 47 municipalities with a total population of about 150,000 inhabitants and an area of 1347.87 km2. The energy community will start with a founding nucleus composed of 6 municipalities, companies and citizens. Another three other energy communities will be born in the Piedmont Region, in the areas of: Val Maira, Val Susa, Monviso Consortium.
Table 8 shows the potential for the different renewable energy sources for the Piedmont Region.
Table 8. Power of RES potential in Piedmont Region
|
|
Hydro |
Wind |
Solar PV |
Biomass |
Waste |
|
GWh |
4,895 |
2,977 |
10,145 |
1,358 |
779 |
The paper analyses a place-based assessment for the analysis of energy consumptions, production and productivity boosting the available renewable energy sources. This methodology utilizes GIS to manage energy-related data and to create maps for the visualization of the areas with the greatest vocation for the production of renewable energies considering the constraints present on the territory, with the final objective of support energy policies. At regional level, this analysis can be used as a decision support tool in the energy planning phases.
This pre-planning assessment that allow to take into consideration regulatory aspects, environmental constraints, and socio-economic aspects, could also help to streamline and speed up the authorization procedures of RES plants.
This work allows local administration to become aware of the regulations, territorial resources and, thanks to the methodology used, apply energy planning consistent with territorial resources.
This work has shown that due to the strong seasonal variability of some renewable energy sources, the balance between consumption, production and productivity should be done at least monthly (or on the average monthly day). With respect to this point, future research will be carried out to implement the new RES Atlas.
[1] Limpasurat, A., Falcone, G., Teodoriu, C., Barrufet, M.A., Barrufet, O.O.B. (2011). Artificial geothermal energy potential of steam-flooded heavy oil reservoirs. International Journal of Oil Gas & Coal Technology, 4(1): 31-46. https://doi.org/10.1504/ijogct.2011.037743
[2] Balat, M. (2006). Current geothermal energy potential in Turkey and use of geothermal energy. Energy Sources, Part B: Economics, Planning, and Policy, 1(1): 55-65. https://doi.org/10.1080/009083190881436
[3] Papurello, D., Vitulli, V., Minuto, F., Bottaccioli, L., Lanzini, A., Borchiellini, R. (2019). Strategies for demand-side management in an office building integrated with rooftop façade PV installations. TI-Italian Journal of Engineering Science, 63(2-4): 311-314. https://doi.org/10.18280/ti-ijes.632-428
[4] Giuliano, A., Catizzone, E., Barisano, D., Nanna, F., Villone, A., De Bari, I., Cornacchia, G., Braccio, G. (2019). Towards methanol economy: A techno-environmental assessment for a bio-methanol OFMSW/biomass/carbon capture-based integrated plant. International Journal of Heat and Technology, 37(3): 665-674. https://doi.org/10.18280/ijht.370301
[5] Adil, A.M., Ko, Y. (2016). Socio-technical evolution of Decentralized Energy Systems: A critical review and implications for urban planning and policy. Renewable and Sustainable Energy Reviews, 57: 1025-1037. http://dx.doi.org/10.1016/j.eser.2015.12.079
[6] Fichera, A., Frasca, M., Volpe, R. (2016). On energy distribution in cities: A model based on complex networks. International Journal of Heat and Technology, 34(4): 611-615. https://doi.org/10.18280/ijht.340409
[7] Liserre, M., Sauter, T., Hung, J. (2010). Future energy systems: integrating renewable energy sources into the smart power grid through industrial electronics. IEEE Industrial Electronics Magazine, 4(1): 18-37. https://doi.org/10.1109/MIE.2010.935861
[8] Nageler, P., Zahrer, G., Heimrath, R., Mach, T., Mauthner, F., Leusbrock, I., Schranzhofer, H., Hochenauer, C. (2017). Novel validated method for GIS based automated dynamic urban building energy simulations. Energy, 139: 142-154. https://doi.org/10.1016/J.ENERGY.2017.07.151
[9] Mutani, G., Todeschi, V. (2019). An urban energy atlas and engineering model for resilient cities. International Journal of Heat and Technology, 37(4): 936-947. https://doi.org/10.18280/ijht.370402
[10] Pfenninger, S., Decarolis, J., Hirth, L., Quoilin, S., Staffell, I. (2016). The importance of open data and software: Is energy research lagging behind. Energy Policy, 101: 211-215. https://doi.org/10.1016/j.enpol.2016.11.046
[11] Spoladore, A., Borelli, D., Devia, F., Mora, F., Schenone, C. (2016). Model for forecasting residential heat demand based on natural gas consumption and energy performance indicators. Applied Energy, 182: 488-499. https://doi.org/10.1016/j.apenergy.2016.08.122
[12] Soldo, B. (2012). Forecasting natural gas consumption. Applied Energy, 92: 26-37. https://doi.org/10.1016/j.apenergy.2011.11.003
[13] Forte, A. (2019). Strumenti e Metodi per la Pianificazione Energetica a scala territoriale. Il caso studio della Regione Piemonte, Bachelor Thesis, Politecnico di Torino.
[14] Šúri, M., Huld, T.A., Dunlop, E.D., Ossenbrink, H.A. (2007). Potential of solar electricity generation in the European Union member states and candidate countries. Solar Energy, 81(10): 1295-1305. https://doi.org/10.1016/j.solener.2006.12.007
[15] Redondi, L. (2015). Biomassa forestale - Una risorsa energetica rinnovabile per la Regione Piemonte, Master Thesis, Politecnico di Torino.
[16] Delmastro, C., Mutani, G., Schranz, L. (2015). Advantages of coupling a woody biomass cogeneration plant with a district heating network for a sustainable built environment: A case study in Luserna San Giovanni (Torino, Italy). Energy Procedia, 78: 794-799. https://doi.org/10.1016/j.egypro.2015.11.102
[17] Carlucci, I., Mutani, G., Martino, M. (2015). Assessment of potential energy producible from agricultural biomass in the municipalities of the Novara plain. 2015 International Conference on Renewable Energy Research and Applications (ICRERA), Palermo, pp. 1394-1398. https://doi.org/10.1109/ICRERA.2015.7418636
[18] Erichsen, H.L., Hauschild, M.Z. (2000). Technical data for waste incineration - background for modelling of product-specific emissions in a life cycle assessment context. Department of Manufacturing Engineering, Technical University of Denmark.
[19] Nazari-Heris, M., Mohammadi-Ivatloo, B. (2017). Distributed Generation Systems. Design, Operation and Grid Integration, pp. 301-332. https://doi.org/10.1016/C2014-0-03902-0
[20] Bourcet, M. (2017). Determinazione del potenziale residuo idroelettrico del sistema irriguo della Città Metropolitana di Torino e valutazione di un impianto in Val Pellice, Master Thesis, Politecnico di Torino.
[21] Renewable Energy First. https://www.renewablesfirst.co.uk/windpower/windpower-learning-centre/how-large-are-farm-wind-turbines-medium-wind-turbines/, accessed on 20 September, 2020.
[22] Meyers, J., Meneveau, C. (2012). Optimal turbine spacing in fully developed wind farm boundary layers. Wind Energy, 15(2): 305-317. https://doi.org/10.1002/we.469