Hua Cao | Yongshen Fan | Zhen Chen | Xiuqiao Huang*
© 2020 IIETA. This article is published by IIETA and is licensed under the CC BY 4.0 license (http://creativecommons.org/licenses/by/4.0/).
OPEN ACCESS
This paper mainly explores the impacts of different fertigation indices of center pivot sprinkling machine (CPSM) on the yield of maize in Northeast China. A total of three fertigation modes were designed: the fertigation based on the CPSM (F1), fertigation based on the micro-sprinkling system (MSS) (F2), and the fertigation mode in which the MSS sprays fertilizers while the CPSM sprays water for drip washing (F3). The three fertigation modes were combined with three water levels (W1-W3) and three fertilizer levels (N1-N3) were. First, the fertilizer uniformities of the three fertigation modes were tested. Then, orthogonal field tests were conducted to observe the growth traits and yield indices of maize in each phase of growth period, under different combinations of fertigation mode, water volume and fertilizer volume. Based on the test results, the authors identified the most significant factors and levels affecting the traits and yield in each phase. The results show that the three fertigation modes can be ranked as F2>F3> F1 in fertilizer uniformity; the highest maize yield (12,807.22kg/hm2) and lowest maize yield (10,324.8kg/hm2) were observed in Plot 5 (W2N2F3) and Plot 1 (W1N1F1), respectively. In general, it is recommended to adopt the combination W2N2F3 to boost the yield of maize.
center pivot sprinkling machine (CPSM), fertigation, micro-sprinkling system (MSS), maize, yield
In many countries, maize is one of the most widely planted food crops, thanks to its high yield, and low occurrence of pests and diseases [1, 2]. Many scholars have developed planting and cultivation methods to improve the yield of maize. For example, Zhang et al. [3] measured the impacts of reduced/no-tillage and continuous tillage on maize yield. Kaur and Arora [4] attempted to increase maize yield through deep tillage and residue mulch. Zhang et al. [5] enhanced the maize yield through straw mulching. Zhang et al. [6] relied on ridge-furrow mulching to improve the maize yield in Northwest China. Guo et al. [7] increased crop yield in maize-wheat rotation by no-tillage and plastic mulching. Many other scholars simulated maize yield with various models. For instance, Chauhdary et al. [8] predicted the maize yield with drip irrigation model. Dokoohaki et al. [9] compared two models to simulate maize yield and water content in soil. Liu et al. [10] conducted model simulation of the relationship between maize yield and cumulative water amount. Yang et al. [11] combined climate model with crop model to forecast maize yield.
To achieve a high yield, a growing amount of fertilizers has been applied in maize fields. During the growth period of maize, however, the excessive application of nitrogen fertilizer might reduce the microbial biomass, bacterial abundance and phylogenetic diversity in soil [12], which undermines the sustainability of the ecosystem. Some scholars held that reducing the use of fertilizers is an effective way to make full use of resources and reduce greenhouse gas (GHG) emissions [13]. For example, Zhang et al. [14] considered no-tillage and low-fertilization the best management mode for erosion control in farmland. Some scholars tried to reduce fertilizer pollution by replacing urea with controlled-release urea [15]. Some other scholars introduced leguminous plants to crop rotations to enhance the nitrogen fixation capacity of soil, reduce the application of nitrogen fertilizer, and improve the sustainability of agricultural systems [16].
Over the years, many studies have been conducted on the growth traits and yield of maize. In most studies, water is introduced to the fields through furrow irrigation [17], flood irrigation [18], mulch-furrow irrigation [19], and mulched drip irrigation [20], while the fertilizers are sprayed artificially [18]. Only a few studies have considered the irrigation mode of drip irrigation [21]. There are only a few reports about the impacts of sprinkler-based fertigation or micro-sprinkler-based fertigation on the growth traits and yield of maize, not to mention the fertigation mode in which micro-sprinklers spray fertilizers while sprinklers spray water for drip washing.
Northeast China is a sparsely populated region with a large per-capita land area. Maize farming is popular among local farmers, for the crop productive and easy to manage. In recent years, China has taken multiple measures to save water and enhance yield in the northeastern region, and introduced many center pivot sprinkling machines (CPSMs) to this region. Nevertheless, these machines have not been well utilized, because the farmers still hold the traditional view that the yield is positively correlated with the amount of water and fertilizers. Under the traditional irrigation and fertilization strategies, many water resources are wasted and an excessive amount of fertilizers is applied, resulting in a series of problems (e.g. soil pollution, groundwater pollution, and air pollution). For the sustainability of regional agriculture, it is imperative to determine the reasonable water amount, fertilizer amount and fertilization mode for Northeast China.
This paper mainly aims to solve the low efficiency of irrigation and fertilization in maize fields of Northeast China, and the ensuing non-point source pollution. Maize was selected as the research object, because it is one of the most widely planted crops in Northeast China. Multiple fertigation modes were designed for the CPSM. Then, orthogonal field tests were conducted to observe the growth traits and yield indices of maize, under each fertigation mode with different water amounts and fertilizer amounts. Based on the test results, the authors identified the optimal water amount, fertilizer amount and fertigation mode for maize fields in Northeast China.
Our tests were conducted in Helongjiang Hydraulic Experiment and Research Center (N: 45°38’36’’; E: 126°22’38’’) from April 27 to September 22, 2018. With an altitude of 152m, the test site has a typical temperate continental monsoon climate. The annual mean precipitation is 569.1mm. The rainy season lasts from June to September.
The soil at the test site belongs to silty loam. In the topsoil, the mean content of organic matter is 2.91%; the mean pH is 8.31, and the mean mass ratios of nitrate nitrogen, total nitrogen, total phosphorus, alkali-hydrolyzable nitrogen, effective phosphorus and available potassium are 20.91mg/kg, 1.689g/kg, 0.731g/kg, 18.525g/kg, 135.88mg/kg, 9.16mg/kg, and 164.80mg/kg, respectively.
The irrigation water was extracted from 60m below the ground.
2.1 Sprinkling irrigation system
Our tests adopt an intelligent remote-controlled CPSM (Lindsay, US). The CPSM is 90m in length, including a 40.5m-long first span, a 40.5m-long second span, and a 9m-long third span. The third span has a spray gun with a sprinkling width of 25m. Thus, the irrigation radius of the CPSM reaches 115m. On the 3.5m-tall CPSM, the sprinklers are installed at 1.5m above the ground.
The fertilization system consists of a fertilizer mixing system and a fertilizer injection system. The former mainly adds fertilizers into the fertilizer mixing tank, stirs them well with an agitator, and transmits the liquid fertilizer to the fertilizer injection tank. The latter injects the liquid fertilizer from the fertilizer injection tank to the sprinklers or micro-sprinklers for fertilization.
The micro-sprinklers were added to the CPSM to enable three different fertigation modes: the fertigation based on the CPSM, fertigation based on the micro-sprinkling system (MSS), and the fertigation mode in which the MSS sprays fertilizers while the CPSM sprays water for drip washing. For simplicity, the three fertigation modes are referred to as the CPSM-based mode (F1), the MSS-based mode (F2) and the CPSM-MSS-based mode (F3).
The CPSM-MSS-based mode can apply a large amount of fertilizers in a short time, while controlling the fertilizer concentration: the drip washing prevents crop leaves from being burned by the fertilizers, and reduces the volatilization of fertilizers intercepted by crop canopy.
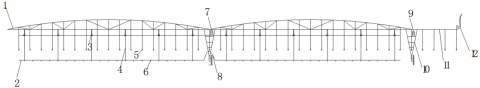
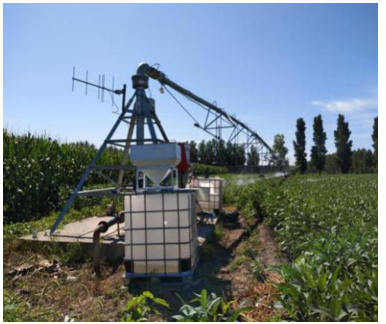
Figures 1-3 are the sketch map of the center pivot in the CPSM, the sketch map of the truss in the CPSM, and the photo of the CPSM at the test site.
Figure 1. The sketch map of the center pivot in the CPSM
Note: 1. Fertilizer bucket; 2. Self-priming pump; 3. Fertilizer hopper; 4. Agitator of fertilizer mixing tank; 5. Filter; 6. Water pipe of fertilizer mixing tank; 7. Center tower of the CPSM; 8. Water pipe of the CPSM; 9. Control cabinet of the CPSM; 10. Solenoid valve on the water pipe of fertilizer mixing tank; 11. Solenoid valve on the water pipe of fertilizer injection tank; 12. Power distribution box; 13. Control cabinet of fertilization system; 14. Water pipe of fertilizer injection tank; 15. Connecting pipe between fertilizer mixing tank and fertilizer injection tank; 16. Liquid level transmitter 17. Agitator of fertilizer injection tank; 18. Fertilizer injection tank; 19. Conductivity meter; 20. Fertilizer tube of plunger pump; 21. Return pipe of plunger pump; 22. Plunger pump; 23. Outlet pipe of plunger pump.
Figure 2. The sketch map of the truss in the CPSM
Note: 1. Truss of the CPSM; 2. Water pipe of the MSS; 3. Pulley; 4. Steel wire rope; 5. Sprinkler(s) of the CPSM; 6. Micro-sprinkler(s); 7. First-span geared motor; 8. High-pressure soft polyethylene (PE) pipe; 9. Second-span geared motor; 10. Tower vehicle; 11. End cantilever; 12. Spray gun.
Figure 3. The photo of the CPSM at the test site
The hydraulic performance of the CPSM under the three fertigation modes F1-F3 was tested at a low wind speed (<3m/s). The drift loss of liquid fertilizer was so small as to be negligible at such a slow wind. The liquid fertilizers of F1-F3 were prepared to the same concentration, and stirred evenly before application. Therefore, the impact of concentration difference was neglected.
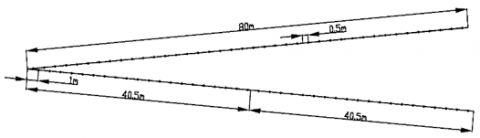
As shown in Figure 4, the rain gauges are arranged in two rows along the radial direction of the CPSM at an interval of 0.5m; the spacing between the two rows is 1m. A total of 160 rain gauges were deployed in two rows, each with 80 rain gauges, in the first and second spans, where the fertilization system is installed.
Figure 4. Layout of rain gauges
The fertilizer uniformity was derived from the depth of liquid fertilizer, according to the modified Herman-Hein formula [22, 23]:
$\mathrm{C}_{\mathrm{UH}}=100 \times\left[1-\frac{\sum_{i=1}^{\mathrm{n}}\left|\mathrm{H}_{\mathrm{i}}-\overline{\mathrm{H}}_{\mathrm{w}}\right| \mathrm{D}_{\mathrm{i}}}{\sum_{i=1}^{\mathrm{n}} \mathrm{H}_{\mathrm{i}} \mathrm{D}_{\mathrm{i}}}\right]$ (1)
where, CUH is the Herman-Hein coefficient of water distribution uniformity; n is the number of rain gauges; i is the serial number of rain gauges (i=1 is the rain gauge closest to the center pivot; i=n is the rain gauge farthest from the center pivot); Hi is the depth of liquid fertilizer in the i-th rain gauge; Di is the distance of the i-th rain gauge to the center pivot; $\overline{\mathrm{H}}_{\mathrm{w}}$ is the weighted mean of liquid fertilizers in all rain gauges.
The depth of liquid fertilizer in the i-th rain gauge Hican be computed by:
$\mathrm{H}_{\mathrm{i}}=\frac{\mathrm{V}_{\mathrm{i}}}{\pi \mathrm{R}^{2}}$ (2)
where, Vi is the volume of the i-th rain gauge; R is the radius of rain gauge(s).
The weighted mean of liquid fertilizers in all rain gauges $\overline{\mathrm{H}}_{\mathrm{w}}$ can be computed by:
$\overline{\mathrm{H}}_{\mathrm{W}}=\frac{\sum_{i=1}^{\mathrm{n}} \mathrm{H}_{\mathrm{i}} \mathrm{D}_{\mathrm{i}}}{\sum_{i=1}^{\mathrm{n}} \mathrm{D}_{\mathrm{i}}}$ (3)
The tested maize variety is Qiangsheng 377. The sowing depth, row spacing and plant spacing were set to 5cm, 66cm and 25cm, respectively. During sowing, the base fertilizer was applied at the amount of 475kg/hm2, equivalent to 244kg/hm2 of pure nutrients (N+P2O5+K2O). The base fertilizer is a mixture of diammonium phosphate (DAP) (N+P2O5≥64.0%), a low nitrogen fertilizer, and compound fertilizer (N+P2O5+K2O≥45%) at the ratio of 1:2.
The orthogonal field tests consider three factors, namely, water amount (W), fertilizer amount (N) and fertigation mode (F). Each of the three factors contains three levels. Therefore, a total of nine combinations were tested. Each combination was tested three times. The test design is illustrated by the L9 (34) orthogonal table below (Table 1).
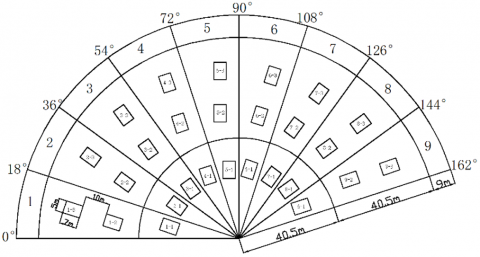
Because the nine combinations were tested three times each, the maize field was divided into 9 parts, corresponding to tests 1-9 in Table 1. These parts were arranged in the circumferential direction of the CPSM at an interval of 18°. Then, each part was further divided into three 7m×5m plots. The layout of the plots is displayed in Figure 5. During the tests, all the plots were subjected to the same management operations, such as weeding and pesticide application.
Table 1. Design of orthogonal field tests
|
Test number |
Factors |
||||
|
Water amount W |
Fertilizer amount N |
Fertigation mode F |
Error E |
Combinations |
|
|
1 |
1 |
1 |
1 |
1 |
W1N1F1 |
|
2 |
1 |
2 |
2 |
2 |
W1N2F2 |
|
3 |
1 |
3 |
3 |
3 |
W1N3F3 |
|
4 |
2 |
1 |
2 |
3 |
W2N1F2 |
|
5 |
2 |
2 |
3 |
1 |
W2N2F3 |
|
6 |
2 |
3 |
1 |
2 |
W2N3F1 |
|
7 |
3 |
1 |
3 |
2 |
W3N1F3 |
|
8 |
3 |
2 |
1 |
3 |
W3N2F1 |
|
9 |
3 |
3 |
2 |
1 |
W3N3F2 |
Figure 5. Layout of the plots
The 148d-long growth period of maize was divided into five phases (Table 2).
Table 2. The five phases of maize growth
|
Period |
Phases |
Number of days/d |
|
April 27 |
Sowing |
0 |
|
April 28 to May 17 |
Seedling |
20 |
|
May 18 to June 30 |
Jointing |
44 |
|
July 1 to August 31 |
Tasseling & filling |
62 |
|
September 1 to September 22 |
Maturity |
22 |
|
|
Total |
148 |
The water amount for each phase is given in Table 3, where low water amount (W1), medium water amount (W2) and high water amount (W3) are 60%, 80% and 100% of field capacity, respectively. The water used for topdressing is included in the water amount.
The maize field was fertilized on August 5, 2018 in the filling phase. The fertilizer amount in each phase is provided in Table 4, where the fertilizer amounts are also converted into the pure nutrient amounts. As mentioned before, the base fertilizer is a mixture of DAP (N+P2O5≥64.0%), and compound fertilizer (N+P2O5+K2O≥45%). The topdressing includes monopotassium phosphate (KH2PO4≧99%) and urea (CO(NH2)2≧46.4%. All fertilizers were assumed to have the lowest purity. The high fertilizer amount (N1) and medium fertilizer amount (N2) were set to 50% and 75% of the high fertilizer amount (N3), respectively.
Table 3. The water amount for each phase
|
Levels |
W/mm |
||||
|
May 7 |
May 20 |
June 2 |
August 7 |
Total |
|
|
W1 |
27.97 |
27.97 |
27.97 |
2 |
85.91 |
|
W2 |
37.3 |
37.3 |
37.3 |
3.73 |
115.63 |
|
W3 |
46.62 |
46.62 |
46.62 |
5 |
144.86 |
|
Fertilizer amounts in the maize field N/(kg/hm2) |
||||||
|
Base fertilizer |
Level of topdressing |
Topdressing |
Amount of topdressing |
Fertilizer amount |
Amount of pure nutrients |
|
|
Monopotassium phosphate |
Urea |
|||||
|
475 |
N1 |
1.5 |
75 |
76.5 |
551.5 |
280.3 |
|
475 |
N2 |
2.25 |
112.5 |
114.8 |
589.8 |
298.4 |
|
475 |
N3 |
3 |
150 |
153 |
628 |
316.6 |
2.4 Measurement items and methods
2.4.1 Meteorological data
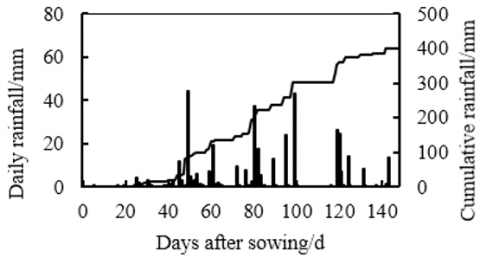
The meteorological data were monitored in real time by a weather station at the test site, including rainfall, air pressure, air temperature, relative humidity, evaporation, wind speed, and ground temperature. The rainfall in the growth period of maize is recorded as Figure 6. It can be seen that the rainfall was merely 1.3mm in the seedling phase, a sign of spring drought. This is the primary cause for the low emergence rate of maize.
Figure 6. Daily rainfall and cumulative rainfall after sowing
2.4.2 Growth traits of maize
At the end of each phase, the plant height was measured with a tapeline, while the leaf length and leaf width were measured with a soft ruler. Then, the leaf area was computed based on leaf length and leaf width by:
$A=K \times L \times B$ (4)
where, A is leaf area (cm2); K is the leaf area coefficient; L is leaf length (cm); B is leaf width (cm). The value of K was empirically set to 0.8.
Specifically, three plots (Figure 5) were selected randomly. Then, three plants were chosen from each plot by random. The height, leaf length and leaf width of the nine selected plants were measured, and the average values were taken as the final measurements. Finally, the leaf area was computed based on leaf length and leaf width.
The root length of maize was also measured at the end of each phase. Three plants were dig out each plot by random, then the main root length of maize was measured with a tapeline.
2.4.3 Yield indices of maize
The maize yield was measured in the maturity phase. First, three 1.5m×1.5m subplots were selected randomly from each plot. The maize from the three subplots was harvested to measure the ear thickness, ear length, barren tip length, grain per ear and rows per ear. The ear thickness, ear length and barren was measured with a tape. Then, the maize was threshed and dried. The dried weight was converted to grain yield per unit area (kg/hm2). Meanwhile, the 100-grain weight and the partial fertilizer productivity (PFP) were also calculated. The PFP refers to the ratio of crop yield to the amount of a specific fertilizer. It reflects the combined effects of the nutrient level of local soil and fertilizer amount. The PFP can be computed by:
$\mathrm{PFP}=\mathrm{Y} / \mathrm{F}$ (5)
where, PFP is the partial fertilizer productivity (kg/kg); Y is the crop yield under the fertilizer (kg/hm2); F is the fertilizer amount (amount of pure nutrients) (kg/hm2).
In addition, the irrigation water productivity (IWP) was calculated. The IWP refers to the number of agricultural products that can be produced per unit of irrigation water. This index reveals the quality of agricultural production, irrigation project and irrigation management. The IWP can be computed by:
IWP $=\mathrm{Y} / \mathrm{I}$ (6)
where, IWP is the irrigation water productivity (kg/hm2); Y is the yield under a specific water amount (kg/hm2); I is the water amount (m3/hm2).
The data were analyzed on Excel 2010 and Data Processing System (DPS) V9.01. The figures were plotted on Excel 2010 and AutoCAD 2007.
3.1 Fertilizer uniformities of three fertigation modes
Figure 7 presents the distributions of the depth of liquid fertilizer in the radial direction of the CPSM under F1, F2 and F3. During the fertigation, the liquid fertilizers of the three modes were of the same concentration, and the CPSM operated at 100% speed under the three modes.
As shown in Figure 7, although the CPSM operated at the same speed, the liquid fertilizer was shallower under F1 than under the other two modes, owing to the small flow (3.87m3/h) of the MSS. The liquid fertilizers under F2 and F3 were of similar depth, thanks to the large flow of the CPSM. The flow of the CPSM (13.26m3/h) was 3.4 times that of the MSS.
According to formula 1, the fertilizer uniformities of F1, F2 and F3 were 63.75%, 91.50% and 80.20%, respectively. Thus, F2 had the highest fertilizer uniformity, while F1 had the lowest. F3 achieved a 25.80% higher fertilizer uniformity than F1. This means fertilizer uniformity is a defect of the MSS (F1), which can be overcome by the coupling between MSS and CPSM (F3).
Figure 7. Distribution of the depth of liquid fertilizer in the radial direction of the CPSM under F1, F2 and F3
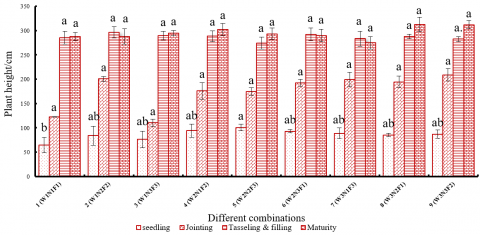
Plant height, an important indicator of crop growth, helps to judge the growth condition and estimate the crop yield [24]. Figure 8 displays the plant heights under different combinations.
It can be seen that, in the seedling phase, the plant height was significantly affected by only one factor: water amount (W). Neither fertilizer amount (N) nor fertigation mode (F) caused significant differences in plant height, because no fertilizer is applied in the seedling phase. The tallest plant (99.83cm) was found in Plot 5 (W2N2F3) irrigated with medium water volume, while the shortest plant (64.83cm) was discovered in Plot 1 (W1N1F1) irrigated with low water volume.
There is no significant difference in height between the plants irrigated with medium water volume W2 and the maize irrigated with high water volume W3. However, the plants irrigated with medium water volume W2 differed greatly in height with those irrigated with low water volume W1. The results show that, in the seedling phase, the plant height does not necessarily decrease, if the water volume is properly reduced. In fact, a suitable water volume promotes the plant height in the seedling phase. Northeast China has a low ground temperature and high diurnal temperature variations in the seedling phase [25]. As a result, excessive irrigation actually lowers the soil porosity and hinders the growth of maize seedlings.
Figure 8. Plant heights in different phases
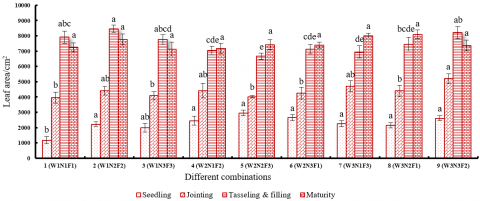
Figure 9. Plant areas in different phases
3.2.2 Leaf areas under different combinations
The leaf area is closely correlated with maize yield. A suitable leaf area can greatly promote the yield. Figure 9 records the leaf areas under different combinations.
It can be seen that, in the seedling phase, Plot 5 (W2N2F3) had the largest leaf area (2,955.59cm2), while Plot 1 (W1N1F1) had the smallest leaf area 1,175.85cm2. In this phase, the leaf areas changed significantly with water volumes, indicating that maize is highly sensitive to water in the early stage of growth.
In the jointing phase, the leaf areas of all plots widened quickly. The largest and smallest leaf areas (5,196.71cm2 vs. 3,959.57cm2) were found in Plot 9 (W3N3F2) and Plot 1 (W1N1F1), respectively. Thus, the water amount still has a significant impact on leaf area in the jointing phase; In the tasseling & filling phase, the largest and smallest leaf areas (8,464.10cm2 vs. 6,660.49cm2) were found in Plot 2 (W1N2F2) and Plot 5 (W2N2F3). The leaf areas of all plots reached the peak size in this phase, an evidence to the activity of vegetative and reproductive growths. In this phase, the leaf area is significantly affected by water volume and fertigation mode, but not greatly impacted by fertilizer volume; In the maturity phase, there was not significant difference between the plots in leaf area.
3.2.3 Root lengths under different combinations
The root system plays an important role in crop growth, and directly bears on the yield [26]. Table 5 provides the root lengths of maize under different combinations.
Table 5. The root lengths of maize under different combinations
|
Plot number |
Root lengths in different phases/cm |
|||
|
Seedling |
Jointing |
Tasseling and filling |
Maturity |
|
|
1 |
14.5d |
16.1b |
31.8b |
35.5a |
|
2 |
16.4cd |
17.65b |
25.8cd |
38.4a |
|
3 |
18.9cd |
19.05b |
32.3b |
38.8a |
|
4 |
20.4bcd |
23.5ab |
37.2a |
43.1a |
|
5 |
20.8bc |
23.5ab |
26.9cd |
37.5a |
|
6 |
25.3ab |
25.15ab |
25.6d |
52.4a |
|
7 |
26.8a |
23.6ab |
38.3a |
41.2a |
|
8 |
30.2a |
28.7ab |
21.2e |
35.4a |
|
9 |
30.9a |
36.6a |
29.7bc |
48.3a |
It can be seen that, in the seedling phase, water volume had a great impact on root length. Based on root length, the three water volumes can be ranked as high water volume (W1) > medium water volume (W2) > low water volume (W1). The growing water volume can promote the rapid growth of the root, due to the severe spring drought in seedling phase.
In the jointing phase, water volume still exerted a significant impact on root length. The root length of maize under medium water volume (W2) differed greatly from that under low water volume (W1), but not significantly from that under high water volume (W3). This is mainly attributable to the growing rainfall in Northeast China in the jointing phase. Medium water volume is sufficient to satisfy the need for root growth. This means the root length is not affected in the jointing phase, if the water volume is reduced properly.
In the tasseling & filling phase, the maize roots grew rapidly due to topdressing. In this phase, Northeast China enters the rainy season. The hot and humid climate limits the impact of water volume on root length. Meanwhile, fertilizer volume and fertigation mode both had significant impacts on root length. Based on root length, the three fertilizer volumes can be ranked as low fertilizer volume (N1) > high fertilizer volume (N3) > medium fertilizer volume (N2). In the tasseling & filling phase, the root growth is promoted by a low fertilizer volume, but inhibited by excessive application of fertilizers. From the economic perspective, it is recommended to apply a low volume of fertilizers in this phase. In terms of fertigation modes, the root length under F3 had a significant difference with that under F1, but no significant difference with that under F2. The three modes can be ranked as F3>F2>F1 in root length.
In the maturity phase, the root length was not greatly influenced by any factor, for the maize is already mature.
3.3 Yield indices under different combinations
Table 6 lists the yield indices of maize under different combinations. In terms of ear length, Plot 6 and Plot 5 are the top two plots, while Plot 2 and Plot 9 are the bottom top plots. The ear length was significantly affected by fertigation mode. The ear length under F1 was the longest, averaging at 22.03cm; the ear length under F2 was the shortest, averaging at 20.66mm. There is no significant difference in ear length between F1 and F3, but a significant difference between F1 and F2.
In terms of ear thickness, Plot 5 and Plot 4 ranked at the top, while Plot 1 and Plot 3 ranked at the bottom. The ear thickness was significantly affected by water volume (W). By ear thickness, the three water volumes can be ranked as medium water volume W2 (54.05mm) > high water volume W3 (52.67mm) > low water volume W1 (49.91mm). There is no significant different in ear thickness between W2 and W3, but a significant difference between W2 and W1. Hence, the ears will not shrink in size (i.e. crop failure) but inflate, if the water volume is properly reduced.
Poor water and fertilizer management will result in hollow kernels at the ear tip. The barren tip length has a great impact on the maize yield. If there are sufficient water and fertilizers in the growth period, the maize kernels will become completely filled, reducing the barren tip length. Otherwise, the barren tip will be relatively long. The longest barren tip was observed in Plot 4 and the shortest in Plot 5. The barren tip length is greatly impacted by the fertilizer volume (N). The longest barren tip (2.08cm) was under the low fertilizer volume (N1), followed by that (1.25cm) under high fertilizer volume (N3), and that (0.76cm) under medium fertilizer volume (N2). To control the barren tip length, the fertilizer volume should be properly increased in the tasseling and filling phase, making the grains plumper and less likely to be hollow. Overall, the medium fertilizer volume is recommended for this phase.
In terms of 100-grain weight, the largest and smallest values were captured in Plot 8 and Plot 1, respectively. Water volume (W) and fertilizer volume (N) both had a significant impact on the 100-grain weight of maize. The three water volumes can be ranked as high water volume (W3) > medium water volume (W2) > low water volume (W1) by 100-grain weight. The 100-grain weight (36.94g) under W3 was not significantly different from that (36.36g) under W2, but clearly different form that (35.38g) under W1. From the economic perspective, it is recommended to adopt the medium water volume. The three fertilizer volumes can be ranked as high fertilizer volume (N3) > medium fertilizer volume (N2) > low fertilizer volume (N1) by 100-grain weight. The 100-grain weight (37.36g) under N3 was not significantly different from that (36.39g) under N2, but clearly different form that (34.92g) under N1. From the economic perspective, it is recommended to adopt the medium fertilizer volume.
In terms of maize yield, the highest value (12,807.22kg/hm2) was achieved in Plot 5 (W2N2F3), and the lowest value (10,324.8kg/hm2) was obtained from Plot 1 (W1N1F1). The yield was significantly affected by water volume and fertilizer volume, but not greatly impacted by fertigation mode. By maize yield, the three water volumes can be ranked as W2>W3>W1, and the three fertilizer volumes can be ranked as N2>N3>N1. Therefore, it is recommended to adopt medium water volume and medium fertilizer volume. However, there was no significant difference between the three fertigation modes. Thus, the CPSM-MSS-based mode (F3) should be selected to achieve a high yield. To sum up, the highest yield can be realized under the combination W2N2F3.
The PFP and IWP were computed by formulas (4) and (5), respectively. The highest PFP (42.92kg/kg) was seen in Plot 5 (W2N2F3), and the lowest PFP (32.85kg/kg) in Plot 3 (W1N3F3). By the PFP, the three fertilizer volumes can be ranked as N2>N1>N3. Hence, the medium fertilizer volume (N2) should be used to obtain high fertilizer productivity. In terms of the IWP, the three water volumes can be ranked as W1>W2>W3, i.e. the low water volume is the best for the IWP. To obtain a high yield, it is recommended to choose the medium water volume.
Table 6. Yield indices under different measurements
|
Plot number |
Ear length/cm |
Barren tip length /cm |
100-grain length/g |
Yield kg/hm2 |
PFP kg/kg |
IWP kg/m3 |
|
1 |
22.36a |
2.08ab |
34.29d |
10,324.8c |
36.83bc |
12.01b |
|
2 |
20.12b |
0.84cd |
34.86bcd |
12,076.59ab |
40.47ab |
14.05a |
|
3 |
21.31ab |
0.9cd |
36.98ab |
10,399.61c |
32.85c |
12.1b |
|
4 |
21.59ab |
2.22a |
34.78cd |
11,950.93ab |
42.64a |
10.33d |
|
5 |
22.41a |
0.63d |
36.71abc |
12,807.22a |
42.92a |
11.07c |
|
6 |
22.54a |
1.16bcd |
37.58a |
10,980.82bc |
34.68c |
9.49e |
|
7 |
22.22a |
1.94ab |
35.7abcd |
11,216.65bc |
40.02ab |
7.74g |
|
8 |
21.18ab |
0.8cd |
37.6a |
12,589.79a |
42.19a |
8.69f |
|
9 |
20.28b |
1.68abc |
37.53a |
11,403.38bc |
36.02bc |
7.87g |
(1) The three fertigation modes can be ranked as F2 > F3 > F1 by fertilizer uniformity. This means fertilizer uniformity is a defect of the MSS (F1), which can be overcome by the coupling between MSS and CPSM (F3).
(2) In the seedling phase, water volume had a significant impact on the growth traits; in the tasseling & filling phase, there was no significant difference in growth traits under different water volumes, owing to the growing rainfall in the rainy reason. Therefore, the lack of water slows down maize growth in the early stage, while the sufficient water supply in the late stage greatly improves the growth traits. In the tasseling & filling phase, the growth traits increased rapidly to the peak values after topdressing, indicating that the rapid growth of maize requires a huge amount of fertilizers.
(3) In terms of maize yield, the highest value was achieved in Plot 5 (W2N2F3), and the lowest value was obtained from Plot 1 (W1N1F1). The yield was significantly affected by water volume and fertilizer volume, but not greatly impacted by fertigation mode. The results show that proper volumes of water and fertilizers can promote maize growth, pushing up the yield. By contrast, the maize yield will decline under excessive application of water and fertilizers. For agricultural sustainability, it is recommended to adopt the combination of W2N2F3, which can improve yield, reduce resource waste and make efficient use of fertilizers.
This paper was supported by National key research and development program of China (No.2016YFC0400104).
[1] Kaur, R., Arora, V.K. (2018). Assessing spring maize responses to irrigation and nitrogen regimes in north-west India using CERES-Maize model. Agricultural Water Management, 209: 171-177. https://doi.org/10.1016/j.agwat.07.022
[2] Xu, X., He, P., Zhang, J.J., Pampolino, M.F., Johnston, A.M., Zhou, W. (2017). Spatial variation of attainable yield and fertilizer requirements for maize at the regional scale in China. Field Crops Research, 203: 8-15. https://10.1016/j.fcr.2016.11.013
[3] Zhang, X.F., Zhu, A.N., Xin, X.L., Yang, W.L., Zhang, J.B., Ding, S.J. (2018). Tillage and residue management for long-term wheat-maize cropping in the North China Plain: I. Crop yield and integrated soil fertility index. Field Crops Research, 221: 157-165. https://doi.org//10.1016/j.fcr.2018.02.025
[4] Kaur, R., Arora, V.K. (2019). Deep tillage and residue mulch effects on productivity and water and nitrogen economy of spring maize in north-west India. Agricultural Water Management, 213: 724-731. https://doi.org//10.1016/j.agwat.2018.11.019
[5] Zhang, Y.Q., Wang, J.D., Gong, S.H., Xu, D., Mo, Y. (2019). Straw mulching enhanced the photosynthetic capacity of field maize by increasing the leaf N use efficiency. Agricultural Water Management, 218: 60-67. https://doi.org//10.1016/j.agwat.2019.03.023
[6] Zhang, X.D., Zhao, J., Yang, L.C., Kamran, M., Xue, X.K., Dong, Z.Y., Jia, Z.K., Han, Q.F. (2019). Ridge-furrow mulching system regulates diurnal temperature amplitude and wetting-drying alternation behavior in soil to promote maize growth and water use in a semiarid region. Field Crops Research, 233: 121-130. https://doi.org//10.1016/j.fcr.2019.01.009
[7] Guo, Y., Yin, W., Hu, F.L., Fan, Z.L., Fan, H., Zhao, C.,Yu, A.Z., Chai, Q., Coulter, J.A. (2019). Reducedirrigation and nitrogen coupled with no-tillage andplastic mulching increase wheat yield in maize-wheatrotation in an arid region. Field Crops Research, 243: 1-9.https://doi.org//10.1016/j.fcr.2019.107615
[8] Chauhdary, J.N., Bakhsh, A., Engel, B.A. and Ragab, R.(2019). Improving corn production by adopting efficientfertigation practices: Experimental and modelingapproach. Agricultural Water Management, 221: 449-461.https://doi.org//10.1016/j.agwat.2019.02.046
[9] Dokoohaki, H., Gheysari, M., Mousavi, S.F., Shahrokh,Z.P., Miguez, F.E., Archontoulis, S.V., Hoogenboom, G.(2016). Coupling and testing a new soil water module inDSSAT CERES-Maize model for maize productionunder semi-arid condition. Agricultural Water Management, 163: 90-99.https://doi.org//10.1016/j.agwat.2015.09.002
[10] Liu, C., Sun, B.C., Tang, H.J., Wang, T.Y., Li, Y., Zhang,D.F., Xie, X.Q., Shi, Y.S., Song, Y.C, Yang, X.H., Li, J.S.(2017). Simple nonlinear model for the relationshipbetween maize yield and cumulative water amount.Journal of Integrative Agriculture, 16(4): 858-866.https://doi.org//10.1016/s2095-3119(16)61493-4
[11] Yang, C.Y., Fraga, H., Ieperen, W.V., Santos, J.A. (2017).Assessment of irrigated maize yield response to climatechange scenarios in Portugal. Agricultural WaterManagement, 184: 178-190.https://doi.org//10.1016/j.agwat.2017.02.004
[12] Yu, H.L., Ling, N., Wang, T.T., Zhu, C., Wang, Y., Wang,S.J., Gao, Q. (2019). Responses of soil biological traitsand bacterial communities to nitrogen fertilizationmediate maize yields across three soil types. Soil andTillage Research, 185: 61-69.https://doi.org//10.1016/j.still.2018.08.017
[13] Zhai, X.J., Zhao, H., Guo, L.Z., Finch, D.M., Huang, D.,Liu, K.S., Tang, S.M., Yang, Y.J., Guo, J.X., Li, J.H., Xie,S., Wang, K. (2018). The emergy of metabolism in thesame ecosystem (maize) under different environmentalconditions. Journal of Cleaner Production, 191: 233-239.https://doi.org//10.1016/j.jclepro.2018.04.208
[14] Zhang, Y.J., Wang, S.L., Wang, H., Wang, R., Wang, X.L.,Li, J. (2018). Crop yield and soil properties of drylandwinter wheat-spring maize rotation in response to 10-year fertilization and conservation tillage practices on theLoess Plateau. Field Crops Research, 225: 170-179.https://doi.org//10.1016/j.fcr.2018.07.003
[15] Yin, M.H., Li, Y.N., Xu, Y.B. (2017). Comparativeeffects of nitrogen application on growth and nitrogenuse in a winter wheat/summer maize rotation system.Journal of Integrative Agriculture, 16(9): 2062-2072.https://doi.org//10.1016/s2095-3119(16)61487-9
[16] Zhou, M.H., Zhu, B., Brüggemann,N., Dannenmann, M.,Wang, Y.Q., Klaus, B.B. (2016). Sustaining cropproductivity while reducing environmental nitrogenlosses in the subtropical wheat-maize cropping systems:A comprehensive case study of nitrogen cycling andbalance. Agriculture, Ecosystems & Environment, 231:1-14. https://doi.org//10.1016/j.agee.2016.06.022
[17] Jia, Q.M., Sun, L.F., Mou, H.Y., Ali, S., Liu, D.H., Zhang,Y., Zhang, P., Ren, X.L., Jia, Z.K. (2018). Effects ofplanting patterns and sowing densities on grain-filling,radiation use efficiency and yield of maize (Zea mays L.)in semi-arid regions. Agricultural Water Management,201: 287-298.https://doi.org//10.1016/j.agwat.2017.11.025
[18] Zhou, X., Wang, R.S., Gao, F., Xiao, H.J., Xu, H.S.,Wang, D.M. (2019). Apple and maize physiologicalcharacteristics and water-use efficiency in an alleycropping system under water and fertilizer coupling inLoess Plateau, China. Agricultural Water Management,221: 1-12. https://doi.org//10.1016/j.agwat.2019.04.019
[19] Dong, Q.G., Yang, Y.C., Zhang, T.B., Zhou, L.F., He, J.Q.,Chau, H.W., Zou, Y.F., Feng, H. (2018). Impacts of ridgewith plastic mulch-furrow irrigation on soil salinity,spring maize yield and water use efficiency in an aridsaline area. Agricultural Water Management, 201: 268-277.https://doi.org//10.1016/j.agwat.2017.12.011
[20] Zhou, L.F., He, J.Q., Qia, Z.J., Dyckd, M., Zou, Y.F.,Zhang, T.B., Feng, H. (2018). Effects of lateral spacingfor drip irrigation and mulching on the distributions ofsoil water and nitrate, maize yield, and water useefficiency. Agricultural Water Management, 199: 190-200.https://doi.org//10.1016/j.agwat.2017.12.028
[21] Liu, H.J., Wang, X.M., Zhang, X., Zhang, L.W., Li, Y.,Huang, G.H. (2017). Evaluation on the responses ofmaize (Zea mays L.) growth, yield and water useefficiency to drip irrigation water under mulch conditionin the Hetao irrigation District of China. AgriculturalWater Management, 179: p. 144-157.https://doi.org//10.1016/j.agwat.2016.05.031
[22] (2005). Agricultural irrigation equipment-Centre-pivotand moving lateral irrigation machines with sprayer orsprinkler nozzles-Determination of uniformity of waterdistribution, GB/T 19797-2012.
[23] Zhao W.X., Li J.S., Yang R.M., Li Y.F. (2014). Fieldevaluation of water distribution characteristics ofvariable rate center pivot irrigation system. Transactionsof the Chinese Society of Agricultural Engineering(Transactions of the CSAE), 30(22): 53-62.https://doi.org//10.3969/j.issn.1002-6819.2014.22.007
[24] Qiu R.C., Miao Y.L., Ji Y.H., Zhang M., Li H., Liu G.(2017). Measurement of Individual Maize Height Basedon RGB-D Camera. Transactions of the Chinese Societyfor Agricultural Machiney, 48(S1): 211-219.https://doi.org//10.6041/j.issn.1000-1298.2017.S0.034
[25] Guo, E.L., Liu, X.P., Zhang, J.Q., Wang, Y.F., Wang, C.L.,Wang, R., Li, D.J. (2017). Assessing spatiotemporalvariation of drought and its impact on maize yield inNortheast China. Journal of Hydrology, 553: 231-247.https://doi.org// 10.1016/j.jhydrol.2017.07.060
[26] Chu G.H., Zhang J.X., Gao Y., Fu J.H., Tang C.Q., WangN.(2018). Effects of nitrogen application rate ontemporal and spatial distribution characteristics of super-high yield spring maize root and yield under dripirrigation. Agricultural Research in the Arid Areas, 36(3):156-160.https://doi.org//10.7606/j.issn.1000-7601.2018.03.24