Yixin Shi | Pin Jiang* | Fujie Wang | Shuxian Zhou
© 2020 IIETA. This article is published by IIETA and is licensed under the CC BY 4.0 license (http://creativecommons.org/licenses/by/4.0/).
OPEN ACCESS
At present, the premixing method is used in the operation of plant protection machines. Premixing and dispensing often lead to uneven proportioning and mixing, thereby reducing the utilization rate of pesticides. There is a great potential safety hazard. In order to improve the effective utilization rate of pesticides in spray operations, an online hybrid system is designed. Based on the theory of computational fluid dynamics, the static mixer model with built-in spoiler was established, and the numerical analysis was carried out by using FLUENT software. The simulation results were analyzed by evaluating the coefficient of variation of mixing uniformity and consistency. Under pressure, the coefficient of variation of pesticide solution mixing was 3.2%. Then carmine solution was used to replace pesticide, and UV spectrophotometry was used to test. The results show that the maximum relative error of mixing stability at the nozzle of the mixing system is 4.301% and the maximum coefficient of variation of pesticide solution is 3.989% under pressurized condition. The experimental coefficient of variation is basically consistent with the simulation results. Practice has proved that the designed online hybrid system has good mixing effect and can be used for the later stage variable spray test of plant protection equipment.
online mixing system, mixer, numerical simulation, spectrophotometry, variation coefficient
The research of on-line mixing technology is mainly divided into three parts: on-line mixing device, mixing effect, mixing theory and control system [1]. The on-line mixing device is mainly divided into two types, jet type and injection typey [2, 3]. Injection variable spray system usually has some problems such as delay [4, 5]. The delay problem of the system can be improved by using the nozzle direct injection system, that is, the pesticide is directly injected into the carrier stream from the front of the nozzle [6, 7], which shortens the conveying distance of pesticide. However, the system has the defect of insufficient mixing of pesticide and carrier stream. In the aspect of analysis and evaluation of fluid mixing uniformity effect, Luck et al. [8] evaluated the application of red rhodamine pigment as tracer in the experiment of measuring uniformity based on absorbance; Based on the iodine decolorization reaction, Vondricka et al. [9] measured the light transmittance of the mixture and obtained the mixing uniformity at each time of on-line mixing, which is different from the method of evaluating the uniformity by measuring the pesticide concentration on the time series [10, 11]. The image processing method is another feasible method for uniformity evaluation. Realpe and Velázquez [12] distinguished the concentration of suspension agent by comparing the gray value, and compared with the detection results obtained by spectrophotometer, it was found that the error was very small; Berthiaux et al. [13] studied the mixing uniformity of two different color powders by principal component analysis (PCA); Muerza et al. [14] used autocorrelation function to dynamically study the static mixing effect of two different color powder particles; Xu et al. [15-17] used fluid image processing technology to study the influence of pump speed and system pressure on mixing uniformity. Efendiev et al. [18], Yang et al. [19], Chen et al. [20], Xu et al. [21] and others have carried out some research on online drug mixing and related control technology. Yin [22] found that by staggering the blades in the mixer, the mixing uniformity was significantly improved with the dislocation angle and the pressure loss in the mixer was significantly reduced. He et al. [23] found that the periodic arrangement of baffle structures inside the flow channel can increase the fluid contact area and induce chaotic advection. A number of domestic scholars have conducted research on the online mixing technology, mainly focusing on the precise control of real-time dosage of low-flow pesticides. Zhang and Liu [24] and Li et al. [25] and Yang et al. [26]. In order to further improve the mixing accuracy and mixing performance of the online mixing system, this paper designs an online mixing system based on the high clearance crop protection equipment spray operation platform, and adopts CFD (Computational Fluid Dynamics) method to carry out numerical simulation for multiple mixers, determine the optimal structure parameters of the mixers, and then carry out experiments to analyze the mixing performance of these mixers, thus providing reference for the design and optimization of online mixing system for crop protection equipment and the later variable spray experiment.
In order to further improve the accuracy and mixing performance of the online mixing system, an online mixed drug system was designed based on the highland gap plant protection machine spray platform, using CFD (Computational Fluid). Dynamics) numerical simulation of a number of mixers, determining the best mixer structure parameters, and conducting experiments, analyzing the mixing performance, providing reference for the design, optimization and variable rate spray test of the online mixing system of the plant protection machine.
2.1 Structure design of online mixing system
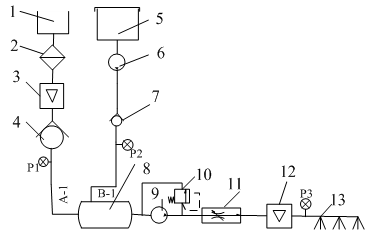
The structure of the online mixing system is shown in Figure 1. It mainly includes water intake unit, pesticide intake unit, mixer, spray unit, control unit, related sensors and detection devices, etc. The detailed parameters of the hardware system of the online mixing system are shown in Table 1. And the working principle of the system is as follows: The required dose of pesticide is extracted from the pesticide tank by peristaltic pump, and injected through check valve into the mixer, then mixes with water drawn into the mixer by diaphragm pump. The mixture is sprayed with the nozzle after being pressurized by diaphragm pump. The application of throttle valve, water flow sensor and pesticide solution flow sensor can accurately control the water intake. And the high-precision diaphragm pump can accurately control the amount of pesticide intake, and its actual flow rate depends on the type of hose selected. The hose type used in this experiment was 18#. Before the experiment, first calibrated the flow of the peristaltic pump: adjusted the speed of the peristaltic pump with the control system, and measured the flow rate at different rotational speeds. The speed-flow curve of the peristaltic pump is shown in Figure 2, which shows that the flow rate of the peristaltic pump is positively related to its speed, and the speed-flow equation is shown in Eq. (1).
$\mathrm{Q}=0.00459 \times r$ (1)
where, Q-the flow rate, L/min r-the rotational speed, r/min.
Figure 1. Schematic diagram of online mixing system
Note: 1 water tank; 2 filter; 3 water flow meter; 4 check valve; 5 pesticide tank; 6 peristaltic pump; 7 check valve; 8 mixer; 9 diaphragm pump; 10 spill valve; 11 throttle valve; 12 pesticide solution flowmeter; 13 nozzle; pressure gauges for P1, P2 and P3; A-1 filling pipe end; B-1 pesticide injection port
Table 1. Structural parameters of online mixing system
|
Item |
Device |
Parameter |
|
Water intake unit |
Diaphragm pump |
Flow rate: 0~160 L/min; Pressure: 0-3 MPa Power source: Diaphragm pump power shaft and motor output shaft are connected by belt |
|
Pressure gauge |
Range: 0~3 MPA; Accuracy: 2.5% |
|
|
Water flow sensor |
Model: YF-DN40; Range: 5~150 L/min; Accuracy: 3% Operating voltage: 5~12 V, powered directly by the development board |
|
|
Pesticide intake unit |
Peristaltic pump |
Model: Huiyu BT100J-1A; Flow rate: 0~0.46 L/min; Accuracy: 1% |
|
Pressure gauge |
Range: 0~3 MPA, precision: 2.5% |
|
|
Spray unit |
Pesticide flow sensor |
Model: YF-DN40; Range: 5~150 L/min; Accuracy: 3% Operating voltage: 5~12 V, powered directly by the development board |
|
Pressure Gauge |
Range: 0~3 MPa, precision: 2.5% |
|
|
Nozzle |
Model: FVP11003; Pressure: 0-3 MPA; Flow rate: 0.8 L/min |
Figure 2. Control system hardware structure diagram
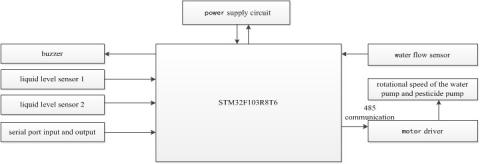
2.2 Design of the online mixing system control system
The online mixing system control system is shown in Figure 2. In order to meet the water flow detection and control, pesticide flow control, high and low liquid level status abnormal buzzer alarm and other functional requirements, STM32F103R8T6 development board was selected. When the control system was working, the required mixing ratio was set through the computer serial port assistant. The amount of pesticide required was calculated by the single-chip computer, according to the set and received real-time water flow data. And the pesticide flow was adjusted by the speed of peristaltic pump which was controlled by RS-485 bus, to make the actual pesticide solution mixing ratio meet the preset value. At the same time, the motor speed could be adjusted by the output frequency of the inverter through the RS-485 bus, and then the real-time water flow could be controlled. The experiment of the influence of diaphragm Pump under off-design condition on the mixing performance of the system was conducted.
2.3 Mixer design of online mixing system
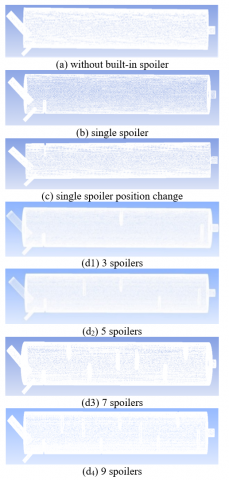
By referring to related literatures, in this paper, the built-in spoiler mixer was selected to optimize the design. According to the actual installation position size, the outlet diameter of the diaphragm pump and peristaltic pump, this paper designed three types of mixers with internal spoiler distributions: single spoiler, single spoiler reverse, and multiple spoilers. And compared these three models with a cylindrical static mixer without spoiler. As shown in Figure 3, the main body of the mixer is a cylinder with a diameter of 0.1 m and a length of 0.5 m. The diameter of the filling pipe end is 0.02 mm, the diameter of the pesticide injection port is 0.01 m, the outlet diameter is 0.02 m, and the size of the first spoiler from the inlet is 0.05 m. The filling pipe end and the pesticide injection port were arranged vertically to ensure that the pesticide liquid was directly injected into the water through the pesticide injection port, and a specific structure and number of spoilers were distributed in the mixer.
Figure 3. Schematic diagram of the mixing unit of the online mixing device
Note: 1outlet 2 spoiler 3 pesticide injection port 4 filling pipe end
3.1 CFD mathematical modeling
SolidWorks software was used to conduct 1:1 3D solid modeling for the mixer. The model is shown in Figure 3. It is known that the mixing effect of the staggered blades is better than that of the in-line arrangement. The number of spoilers were increased in the Model d in sequence, and the spoiler was staggered in the pipe in helical equidistance. The models d1, d2, d3 and d4 were established in sequence, and the number of internal spoiler was 3, 5, 7 and 9 respectively. It is known that the spray volume is 140L/min, and the pesticide solution ratio is 1:300 to 1:3000. According to the Reynolds Number and turbulence intensity formula (2), (3), it was calculated that the Reynolds Number of the flow field in the mixer was 29533, which was in the complete turbulence interval, so the standard turbulence model k-ε was adopted for the flow field. As the model was water-pesticide mixture, Eulerian model and mixing model in Fluent could be selected. However, the calculation stability of Eulerian model is relatively poor, existing a problem without convergence. Therefore, the mixing model was chosen in this paper. The mass conservation equation and the mixed flow equation [24] of the mixing model are as follows:
$\operatorname{Re}_{D H}=\frac{D \rho u}{\mu}, u=\frac{v_{1}+v_{2}}{\frac{1}{4} \pi D^{2} \times 3600}$ (2)
$I=0.16\left(\mathrm{Re}_{D H}\right)^{-1 / 8}$ (3)
$\partial p_{m}+\nabla \times\left(p_{m} v_{m}\right)=S_{m}, v_{m}=\frac{\sum_{i=1}^{n} a_{i} p_{i} v_{i}}{p_{m}}$ (4)
where,
pm-the average density of the pesticide solution mixture phase, kg/m³;
vm-the average flow rate of the pesticide solution phase, m/s;
ai-the volume fraction of the i-th phase;
pi- the density of the i-th phase;
vi-the average flow velocity of the i-th phase (i =1 or 2, where the first phase is the water phase and the second phase is the pharmaceutical phase);
v1, v2-the volume flow rate of pesticide and water, m³/h.
3.2 Boundary conditions and parameter settings
The boundary conditions of the mixer were set according to the actual mixing ratio requirements. The main parameters are shown in Table 2. Among them, the filling pipe end and the pesticide injection port are speed inlets, respectively set as water phase and pharmaceutical phase, pressure outlet for outlet, the interface surface for the intersection of the filling pipe end and the pesticide injection port with the interior of the mixer, and the wall for the tube wall of the mixer tube. Simple algorithm and Second Order Upwind were adopted to solve the equations. The volume fraction and residual of liquid at outlet were used as monitors, the convergence accuracy was set to 10-5, and the convergence within 5000 steps was calculated.
Table 2. Basic parameters and boundary condition settings
|
Item |
Filling pipe end |
Pesticide injection port |
|
Hydraulic diameter (mm) |
20 |
10 |
|
Flow rate (m•s-1) |
7.4 |
0.1 |
|
Density (kg•m-³) |
1000 |
1003 |
|
Pressure (Mpa) |
0.1 |
1 or 0.1 |
|
Turbulence Intensity (%) |
5 |
5 |
3.3 Meshing
ICEM module in ANSYS16.0 was used for the division of the fluid domain mesh of the mixer. Due to the complex structure of the mixer, block division method was adopted in grid division to refine the mesh of pesticide injection port, filling pipe end and outlet of the mixer. And the whole grid area was divided by a method of combination with structured grid and unstructured grid. The grid division of the mixer is shown in Figure 4. The grid numbers of (a), (b), (c), (d1), (d2), (d3), and (d4) are 2473347, 2280608, 2731353, 3442783, 3685568 and 3702420 respectively, showing good quality of grid division.
Figure 4. Built-in spoiler mixer meshing diagram
3.4 Analysis of simulation results
The current detection indicators for the mixing effect of the static mixer include relative standard deviation, the variation coefficient, distribution of residence time, and shear rate and so on. Considering the feasibility of the experimental subject, software simulation and experimental examination, the variation coefficient CV is proposed to be the index to evaluate the mixing effect. The value range of the variation coefficient CV is from 0 to 1. When the value is 1, it is considered to be completely unmixed. Theoretically, when the CV is less than 5%, it can be considered to be completely mixed. The formula of the variation coefficient is as follows:
$C V=\frac{\sigma}{\bar{c}}=\frac{\sqrt{\frac{1}{N} \sum\left(c_{i}-\bar{c}\right)}}{\frac{1}{N} \sum c_{i}}$ (5)
where,
ci-the concentration of the pesticide in the i-th area, mg/L;
σ-he standard deviation of the agent concentration;
$\begin{equation}
\bar{c}
\end{equation}$ -the average concentration of the pesticide solution in the entire cross section, mg/L.
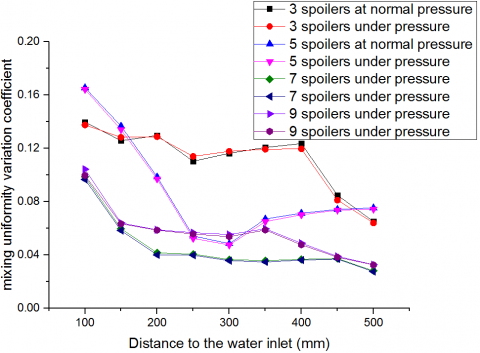
According to the actual conditions, the concentration is replaced by the volume fraction in the simulation calculation. Different mixer models take cross sections from 0.1 m to the outlet along the axis direction when the pesticide pressure and water pressure are all 0.1 MPa, and calculate the CV value of each cross section. As shown in Table 3, the increase in the number of spoilers inside the mixer can help liquid mixing at normal pressure of the pesticide solution. When the number of spoilers are 7, the pesticide solution in the mixer mixes evenly at 220 mm from the filling pipe end and the variation coefficient is 0.031, the variation coefficient at the exit is 0.022, which meets the design requirements.
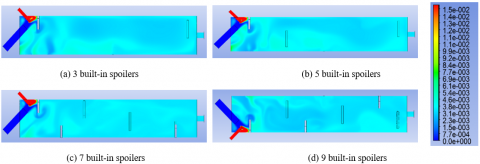
Figure 5 shows the pesticide liquid volume fraction cloud chart of the four optimization models of model d on the axial center section. As shown in Figure 5, when the density and viscosity of the simulated pesticides are exactly the same, the increase in the number of spoilers inside the mixer helps liquid mixing, but there is distortion. When the spoiler is increased to a certain number, the mixing performance becomes worse, which is consistent with the simulation data. Through numerical simulation, it is found that the mixing effect is the best when seven spoilers are arranged inside the mixer.
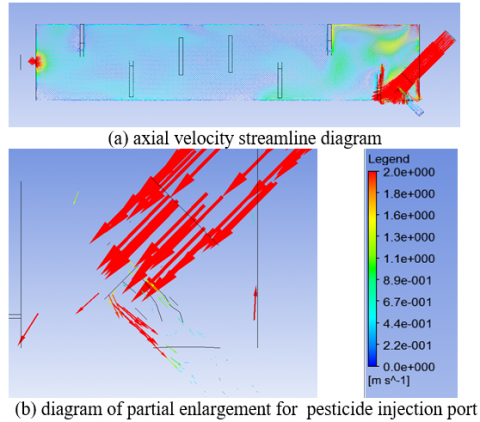
Figure 6 is a pesticide solution flow diagram of the axial direction of mixer. It is found that there is a slight pesticide liquid reflux in the pesticide injection port. Therefore, an online mixing system for the mixer that pesticide is injected at high pressure is proposed. As the pressure of the nozzle was 0.3 Mpa, and there was pressure loss in the entire online mixing system loop, so the pressure of the injection port was set to 1Mpa, and numerical simulation was carried out. The simulation results are shown in Figure 7. From which, we can see that the mixing uniformity of the mixer pressurized state is better than that of normal pressure; under the condition that the mixture ratio of pesticide is 300:1, among the seven designed models, when seven spoilers are built in model d4, the variation coefficient is the lowest and the mixing effect is the best. At 250 mm from the filling pipe end, that is, under the third spoiler, the pesticide solution was mixed evenly, the variation coefficient was 0.038, and the variation coefficient at the outlet of the mixer was 0.02, which met the standard of the mixing uniformity coefficient.
Table 3. Simulated values of coefficient of variation for different cross-section models of different mixer model
|
The CV value of Models |
Distance to the filling pipe end (mm) |
|||||||
|
100 |
170 |
220 |
270 |
320 |
420 |
470 |
510 (Outlet) |
|
|
Model a |
0.866 |
0.634 |
0.528 |
0.462 |
0.414 |
0.397 |
0.372 |
0.308 |
|
Model b |
0.856 |
0.629 |
0.518 |
0.451 |
0.410 |
0.385 |
0.365 |
0.301 |
|
Model c |
0.877 |
0.693 |
0.561 |
0.486 |
0.447 |
0.422 |
0.405 |
0.352 |
|
Model d1 |
0.135 |
0.114 |
0.114 |
0.095 |
0.098 |
0.111 |
0.085 |
0.067 |
|
Model d2 |
0.162 |
0.132 |
0.097 |
0.060 |
0.054 |
0.063 |
0.065 |
0.070 |
|
Model d3 |
0.092 |
0.06 |
0.031 |
0.039 |
0.025 |
0.036 |
0.033 |
0.022 |
|
Model d4 |
0.140 |
0.084 |
0.064 |
0.087 |
0.042 |
0.075 |
0.159 |
0.029 |
Figure 5. Mixer axial pesticide liquid integral number cloud
Figure 6. Axial velocity streamline diagram
Figure 7. Mixer coefficient of variation analog value curve
A simulation analysis was conducted on the model with seven built-in spoilers by increasing the pesticide solution mixing ratio. When the pesticide and water ratio was 3000:1, the coefficient of variation at the outlet of the mixer was 0.018, which met the requirement of CV < 5%. Therefore, this paper selected the model d4 with seven spoilers for experiment.
4.1 Experimental conditions
According to the numerical simulation results of the mixer in the online mixing system, an online mixing method for pressurized injection of pesticide solution is proposed and the system structure is shown in Figure 1.
(a) Experiment platform in the laboratory
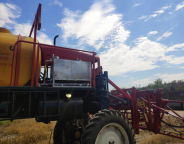
(b) Practical application of the machine
Figure 8. Online mixing system physical map
Considering the pressure of the selected nozzle and pipeline pressure loss, the peristaltic pump can be replaced by electromagnetic diaphragm metering pump to carry out the pesticide solution pressure experiment. Electromagnetic diaphragm metering pump: pressure 1 MPa, flow rate is from 0 to 0.5 L/min, working voltage 220 V, accuracy ±1%. The control method is the same as that of diaphragm pump. The experiments were conducted under the conditions of normal pressure and pressurized state of the pesticide solution respectively and it was carried out in the Intelligent Agricultural Machinery Laboratory at the College of Engineering of Hunan Agricultural University. The physical device is shown in Figure 8.
4.2 Experimental method
By referring to the relevant literatures and combining with the existing conditions in the laboratory, we used the ultraviolet spectrophotometry to perform the mixer performance experiment. Before the experiment, the cochineal standard solution curve had been established. Five parts of carmine solution with a concentration of 3 g/L were prepared instead of water-soluble pesticides, and the sample solution was diluted to concentrations of 1 mg/L, 1.5 mg/L, 2 mg/L, 2.5 mg/L, 3 mg/L standard samples, and pure water was used as a blank reference. The UVmini-1240 UV ultraviolet and visible spectrophotometer of Shimadzu Corporation was used to measure the absorbance, the absorption wavelength was set as λ=507mn, and the absorbance of the above samples were measured successively. The data obtained are shown in Table 4:
Table 4. Absorbance of carmine red standard solution at wavelength 507
|
Number |
1 |
2 |
3 |
4 |
5 |
|
Concentration (mg/L) |
1 |
1.5 |
2 |
2.5 |
3 |
|
absorbance ABS |
0.022 |
0.033 |
0.041 |
0.053 |
0.066 |
MATLAB and the least square method were used to process the experimental data. The regression equation is shown in Eq. (6).
$\begin{equation}
A B S=0.0216 \times C-0.002
\end{equation}$ (6)
where,
ABS - the absorbance; C - the concentration, mg/L.
The ratio coefficient was input according to the mixing ratio requirement of the pesticide solution, and the flow data collected by the water flow sensor were read by the control unit. The speed of the peristaltic pump was controlled through the RS-485 bus according to the actual ratio requirements, and the actual pesticide flow was adjusted according to the required ratio. In line with the experiment requirements, a measuring glass was placed under the nozzle to take a sample. The mixing stability and uniformity of the online mixing system were respectively detected under different injection pressures and different pesticide solution ratios.
Table 5. Mixture stability test data under different pressures
|
Proportion |
Pesticide pressure (Mpa) |
Expected quality concentration (mg/L) |
Actual concentration (mg/L) |
Absolute error (mg/L) |
Relative error (%) |
|
300:1 |
1 |
10.00 |
10.052 |
-0.052 |
0.517 |
|
600:1 |
1 |
5.00 |
5.081 |
-0.081 |
1.625 |
|
1000:1 |
1 |
3.00 |
3.126 |
-0.126 |
4.20 |
|
1500:1 |
1 |
2.00 |
2.086 |
-0.086 |
4.301 |
|
2000:1 |
1 |
1.50 |
1.491 |
0.09 |
0.622 |
|
2500:1 |
1 |
1.20 |
1.246 |
-0.046 |
3.840 |
|
3000:1 |
1 |
1.00 |
-0.011 |
1.071 |
1.011 |
Table 6. Mixing uniformity coefficient at the outlet of the mixer under different mixing ratios
|
Mixing ratio |
300:1 |
600:1 |
1000:1 |
1500:1 |
2000:1 |
2500:1 |
3000:1 |
|||||||
|
Sampling sequence number |
KA |
KC |
KA |
KC |
KA |
KC |
KA |
KC |
KA |
KC |
KA |
KC |
KA |
KC |
|
1 |
0.217 |
10.056 |
0.113 |
5.224 |
0.070 |
3.244 |
0.045 |
2.086 |
0.034 |
1.578 |
0.027 |
1.255 |
0.022 |
1.025 |
|
2 |
0.218 |
10.102 |
0.120 |
5.547 |
0.070 |
3.244 |
0.046 |
2.132 |
0.030 |
1.394 |
0.027 |
1.255 |
0.022 |
1.025 |
|
3 |
0.214 |
9.917 |
0.107 |
4.947 |
0.067 |
3.111 |
0.042 |
1.948 |
0.033 |
1.532 |
0.026 |
1.209 |
0.021 |
0.978 |
|
4 |
0.221 |
10.241 |
0.106 |
4.901 |
0.070 |
3.240 |
0.043 |
1.994 |
0.031 |
1.440 |
0.026 |
1.209 |
0.022 |
1.025 |
|
5 |
0.216 |
10.009 |
0.108 |
4.994 |
0.069 |
3.194 |
0.046 |
2.132 |
0.033 |
1.532 |
0.029 |
1.348 |
0.022 |
1.025 |
|
6 |
0.212 |
9.824 |
0.109 |
5.040 |
0.067 |
3.101 |
0.046 |
2.132 |
0.033 |
1.532 |
0.027 |
1.255 |
0.021 |
0.978 |
|
7 |
0.217 |
10.056 |
0.106 |
4.901 |
0.065 |
3.009 |
0.046 |
2.132 |
0.033 |
1.532 |
0.027 |
1.255 |
0.022 |
1.025 |
|
8 |
0.209 |
9.685 |
0.108 |
4.994 |
0.066 |
3.055 |
0.046 |
2.132 |
0.031 |
1.440 |
0.025 |
1.163 |
0.022 |
1.025 |
|
9 |
0.219 |
10.148 |
0.110 |
5.086 |
0.064 |
2.963 |
0.045 |
2.086 |
0.032 |
1.486 |
0.026 |
1.209 |
0.021 |
0.978 |
|
10 |
0.221 |
10.241 |
0.112 |
5.178 |
0.067 |
3.101 |
0.045 |
2.086 |
0.031 |
1.440 |
0.028 |
1.301 |
0.022 |
1.025 |
|
Mean value |
10.027 |
5.081 |
3.126 |
2.086 |
1.491 |
1.246 |
1.011 |
|||||||
|
Standard deviation |
0.168 |
0.186 |
0.096 |
0.062 |
0.056 |
0.050 |
0.021 |
|||||||
|
The variation coefficient |
1.679 |
3.666 |
3.073 |
2.968 |
3.779 |
3.989 |
2.093 |
|||||||
Note: KA is absorbance, KC is concentration
4.3 Stability experiment of pesticide mixture
Samples were taken at different times and at different ratios of the pesticide solution while the liquid pesticide was under pressurized state. Measuring glasses were placed under 18 nozzles in three circuits to collect the mixed liquid in sequence. Samples were taken once every 30 s, and then 2 s each time. The 18 samples were 1 group and the average value was taken.
The experiment was carried out under the liquid pesticide pressurization system. The pesticide solution was pressurized by the electromagnetic diaphragm metering pump, and it could still be injected into the mixer smoothly when the pesticide solution ratio increased. See Table 6 for the data of the stability of pesticide mixture under pressurized state.
According to Table 5, the maximum relative error is 4.301% when the pressure is 1 Mpa, and the absolute error is less than 0.126 mg/L. The absolute error and relative error of the pesticide solution concentration are improved. Since manual measurement was adopted in the experiment, the experimental error has a certain randomness. It can be considered to build an online mixing system detection platform for systematic measurement later.
4.4 Mixing uniformity experiment
According to the numerical simulation results and the mixed pesticide stability experiment, the mixing stability and uniformity of the pesticide solution under pressure are better than that under normal pressure, so the mixing uniformity experiment was conducted on the agent pressurization experiment platform. Sampling method: change the mixing ratio of pesticide solution, sample with a measuring glass under the same nozzle, sampling for 2 min in each group, take 10 random samples in each sampling period, and take 2 s for a single sample.
The mixing uniformity is one of the important evaluation indexes of the mixing effect of the mixer. In this paper, the actual concentration under different ratios was obtained according to the absorbance of the cochineal mixed solution under different proportions. The variation coefficient under different mixing ratios is calculated by formula (5), as shown in Table 6.
According to Table 6, the actual concentration of the cochineal mixed solution is close to the expected concentration. In the range of 300:1~3000:1, the mixing uniformity variation coefficient CV is less than 3.989%, which meets the design requirements of the variation coefficient CV is less than 5%. So the designed online mixing system has better mixing effect. The variation coefficient of mixing uniformity of the online mixing system under pressure basically coincides with the simulation results, with a small error, indicating that the experiment results are in line with expectations, and the established CFD model is real and effective.
(1) This paper designed a set of accurate online mixing system, which can improve the effective utilization rate of pesticides in spray operation. Numerical simulation of the mixer used in the mixing system shows that adding spoiler inside the mixer can improve the mixing uniformity. And the mixing effect is the best when there are 7 spoilers inside the mixer and the pesticide solution flows are facing the first spoiler.
(2) When an experiment of the online mixing system was conducted for the mixing uniformity and stability, the pressure was 1 MPa, the relative error of the mixing concentration of the pesticide solution was 4.301% at the maximum, which is significantly better than the 6% of the normal pressure experiment, and the mixing performance is better. And the variation coefficient of the pressurized pesticide solution is less than 3.989%, which proves that the design system has a good mixing performance.
(3) The off-design condition experiment of the online mixing system proves that when the water flow changes, the online mixing system still have a good mixing effect in the pesticide mixing ratio of 300:1 to 3000:1, and the system can be used in the variable spray operation mode, which provides certain reference for the variable spray experiment of crop protection equipment later.
(4) By comparing the simulation value of the mixing uniformity coefficient with the experimental value, it is found that the simulation result is basically consistent with the experiment result. The established CFD model can accurately describe the flow field change in the mixer and the mixing effect of the online mixture system. When conditions and apparatus of the experiment are limited, CFD can be used for virtual experiment to provide more theoretical basis for the design and optimization of online mixing system.
We acknowledge support from the National Key Research and Development Program of China (Grant No.: 2017YFD0700903-2), the Hunan Key Research and Development Program (Grant No.: 2020GK4075, Grant No.: 2019NK2141, Grant No.: 2018NK2063).
[1] Yuan, Y.B., Hu, L., Luo, X.W., Zhang, M., Zhou, H., Zhao, R.M. (2016). Design and experiment of online mixing spraying system. Transactions of the Chinese Society for Agricultural Machinery, 47(sl): 176-181. https://doi.org/10.6041/j.issn.1000-1298.2016.S0.027
[2] Li, Z., Song, S.R. (2018). Online drug mixing technology and prospect in pesticide spraying. Journal of Agricultural Mechanization Research, 40(1): 1-6. https://doi.org/10.13427/j.cnki.njyi.2018.01.001
[3] Qi, H., Liao, H., Lan, Y. (2019). Research status and prospect of automatic pesticide mixing device. Journal of Agricultural Science and Technology (Beijing), 21(7): 10-18. https://doi.org/10.13304/j.nykjdb.2018.0779
[4] Zhu, H., Fox, R.D., Ozkan, H.E., Brazee, R.D., Derksen, R.C. (1998). A system to determine lag time and mixture uniformity for inline injection sprayers. Applied Engineering in Agriculture, 14(2): 103-110. https://doi.org/10.13031/2013.19369
[5] Luck, J.D., Shearer, S.A., Luck, B.D., Sama, M.P. (2016). Recalibration methodology to compensate for changing fluid properties in an individual nozzle direct injection system. Transactions of the ASABE, 59(3): 847-859. https://doi.org/10.13031/trans.59.11521
[6] Vondricka, J., Hloben, P., Lammers, P.S. (2007). Optimization of direct nozzle injection system for site-specific herbicide application. In 2007 ASAE Annual Meeting. American Society of Agricultural and Biological Engineers. https://doi.org/10.13031/2013.22906
[7] Zhu, H., Ozkan, H.E., Fox, R.D., Brazee, R.D., Derksen, R.C. (1998). Mixture uniformity in supply lines and spray patterns of a laboratory injection sprayer. Applied Engineering in Agriculture, 14(3): 223-230. https://doi.org/10.13031/2013.19380
[8] Luck, J.D., Shearer, S.A., Luck, B.D., Payne, F.A. (2012). Evaluation of a rhodamine-WT dye/glycerin mixture as a tracer for testing direct injection systems for agricultural sprayers. Applied Engineering in Agriculture, 28(5): 643-646. https://doi.org/10.13031/2013.42424
[9] Vondricka, J., Lammers, P.S. (2009). Measurement of mixture homogeneity in direct injection systems. Transactions of the ASABE, 52(1): 61-66. https://doi.org/10.13031/2013.25941
[10] Vondricka, J., Lammers, P.S. (2009). Evaluation of a carrier control valve for a direct nozzle injection system. Biosystems Engineering, 103(1): 43-48. https://doi.org/10.1016/j.biosystemseng.2009.02.008
[11] Hloben, P. (2007). Study on the response time of direct injection systems for variable rate application of herbicides. Bonn:University of Bonn.
[12] Realpe, A., Velázquez, C. (2003). Image processing and analysis for determination of concentrations of powder mixtures. Powder Technology, 134(3): 193-200. https://doi.org/10.1016/S0032-5910(03)00138-4
[13] Berthiaux, H., Mosorov, V., Tomczak, L., Gatumel, C., Demeyre, J.F. (2006). Principal component analysis for characterising homogeneity in powder mixing using image processing techniques. Chemical Engineering and Processing: Process Intensification, 45(5): 397-403. https://doi.org/10.1016/j.cep.2005.10.005
[14] Muerza, S., Berthiaux, H., Massol-Chaudeur, S., Thomas, G. (2002). A dynamic study of static mixing using on-line image analysis. Powder Technology, 128(2-3): 195-204. https://doi.org/10.1016/S0032-5910(02)00197-3
[15] Xu, Y., Wang, X., Zheng, J., Zhou, F. (2010). Simulation and experiment on agricultural chemical mixing process for direct injection system based on CFD. Transactions of the Chinese Society of Agricultural Engineering, 26(5): 148-152. https://doi.org/10.3969/j.issn.1002-6819.2010.05.026
[16] Xu, Y., Zhou, F., Guo, J., Wang, X. (2008). Flow field simulation of chemical mixing process for direct injection system based on CFD. In 2008 Providence, Rhode Island, American Society of Agricultural and Biological Engineers. https://doi.org/10.13031/2013.24606
[17] Sun, H.J., Bai, B.F., Yan, J.J., Zhang, H.B. (2013). Single-jet spray mixing with a confined crossflow. Chinese Journal of Chemical Engineering, 21(1): 14-24. https://doi.org/10.1016/S1004-9541(13)60436-X
[18] Efendiev, Y., Gildin, E., Yang, Y. (2016). Online adaptive local-global model reduction for flows in heterogeneous porous media. Computation, 4(2): 22. https://doi.org/10.3390/computation4020022
[19] Yang, Y., Fu, S., Chung, E.T. (2020). Online mixed multiscale finite element method with oversampling and its applications. Journal of Scientific Computing, 82(2): 31. https://doi.org/10.1007/s10915-019-01121-y
[20] Chen, H.X., Chen, Z.G., Zhao, X., Chen, M.X., Chen, J.J. (2014). Study on online mixing pesticide technology and automatic control and detection of concentration. In Advanced Materials Research, 838: 2019-2024. https://doi.org/10.4028/www.scientific.net/AMR.838-841.2019
[21] Xu, X.C., Qiu, B.J., Deng, B., Jia, F.W. (2012). Analysis on online mixing performance of jet-mixing apparatus. In Advanced Materials Research, 347: 417-421. https://doi.org/10.4028/www.scientific.net/AMR.347-353.417
[22] Yin, H.X. (2006). Simulation and optimization for tubular static mixer with rows of tabs. Harbin Institute of Technology.
[23] He, X.H., Wang, Y., Gao, L.F. (2018). Characteristics of micromixer with periodicblocks and baffles. Journal of Drainage and Irrigation Machinery Engineering (JDIME), 36(12): 1282-1287. https://doi.org/10.3969/j.issn.1674-8530.16.0317
[24] Zhang, W., Liu, Z. (2011). Experiment on variable rate spray with real-time mixing pesticide of 3WY-A3 sprayer. Transactions of the Chinese Society of Agricultural Engineering, 27(11): 130-133. https://doi.org/10.3969/j.issn.1002-6819.2011.11.025
[25] Li, J., Jia, W., Wei, X. (2014). On-line mixing pesticide device based on flow control valve and neural network. Nongye Jixie Xuebao Transactions of the Chinese Society for Agricultural Machinery, 45(11): 98-103. https://doi.org/10.6041/j.issn.1000-1298.2014.11.015
[26] Yang, Z., Niu, M., Li, J., Xu, X., Xu, J., Chen, Z. (2015). Design and experiment of an electrostatic sprayer with online mixing system for orchard. Transactions of the Chinese Society of Agricultural Engineering, 31(21): 60-67. https://doi.org/10.11975/j.issn.1002-6819.2015.21.008