Miloud Bentoumi* | Ahmed Bentoumi | Haddi Bakhti
© 2020 IIETA. This article is published by IIETA and is licensed under the CC BY 4.0 license (http://creativecommons.org/licenses/by/4.0/).
OPEN ACCESS
This work deals to introduce a new idea inspired from the empirical mode decomposition (EMD) technique in order to detect a leak in water distribution networks (WDN). Welsh’s power spectral density (WPSDE) is used to locate the frequency band in which leaks occur. Leaks produce acoustic and vibration signals propagating along the pipeline, which have nonlinear and non-stationary characteristics. Hydraulic pressure, the nature and diameter of the pipe as well as the size of the leak are considered as sources acting on the leakage signals. The analysis of such leakage signals using conventional methods is limited by the choice of the narrow bands and cause therefore the loss of useful information. EMD is a technique that allows the decomposition of a signal in the time domain as stationary oscillatory signals called intrinsic mode functions (IMFs), which can be processed separately. Experiments were carried out to verify the validity of the proposed method. That shows its best performances in detecting leaks. For the localization, we applied the Short-Time Fourier Transform (STFT) technique that has the potential to locate leaks at greater distances from a measurement point and proved its efficiency.
leak, vibration sensor, EMD, WPSDE, detection
The leak detection is a discipline that is part of the non-destructive testing techniques. Several techniques of detection and localization are developed because the fluid that we try to protect is available in limited quantity and capable of causing damage around the leakage point. Obviously, a leak is a flow of liquid through a crack in the pipe wall. Indeed, drinking water has become a major worry for societies [1, 2]. It is conveyed to consumers by a network of pipes of an increasingly smaller diameter from 40 cm up to 32 mm, with a pressure of up to 5.5 bar [3]. Water loss occurs in all distribution systems, only the volume of loss varies with the diameter of the leak [4]. Water transport and distribution networks naturally deteriorate over time and lose their water tightness [5]. Water is lost due to leaks in the various components of the networks, which include transmission tubes, distribution pipes, service connection pipes, joints, valves, hydrants, and storage tanks and reservoirs [6]. The objective is not to predict the indications of probable failure, but to capture the existing fault tracks (crack) in the pipeline. An orifice on the wall of the pipe can cause several physical changes in the ground, and the pipe such as the pressure applied on the latter, the evolution of the soil moisture. Each of these phenomena can be used as a key symptom for monitoring the water distribution network. Therefore, the network operators began investigating ways to detect the presence of leaks and that as early as possible to intervene at the appropriate time. The reduction in time between the formation of a leak and its precise location is among the key factors to achieve a good system performance [3]. A leak in a pipe can cause significant economic losses and can even under a reduced pressure contaminated water [3]. Detecting a leak is to say use devices and applying techniques. A significant percentage of water is lost due to these leaks [4]. To accurately locate leaks, different methods are implemented [5-7], in general, in stages. From a sector considered impaired, we try to identify the fugitive section called pre location and then determining the precise leak position called localization. Conventional methods, for instance, Fast Fourier Transform (FFT), and correlation based on the Fourier transform widely used in the leak detection area are quite limited and their sensitivity is random and depends on many factors, like fluid nature, fault geometry, and background noise. The wavelet transform overcomes these difficulties but its interpretation remains difficult to accurately characterize signals. It can also be said that the choice of the mother wavelet, which is appropriate for the application, is difficult. The Hilbert-Huang transform is a new approach to the decomposition of signals for purposes usable in different areas. The latter can effectively treat non-linear and non-stationary data. This technique has demonstrated its validity in the detection of bearing defects. In the case of a leak in a pressurized pipeline, the pipeline vibrates at the exit point of water and propagates along the pipe. The vibrations are due to local fluctuations of the pressure field associated with other phenomena in the fluid. When a leak occurs, a large number of hydraulic fluctuations occur randomly and incoherently in the time and the volume of fluid. The resulting signal has the appearance of a quasi-stationary noise [8, 9]. Feng et al. [10] proposed an approach based on the gradient method for a dual pressure sensor. Gao et al. [11] compared the same GCC methods with the method (BCC) for the detection of leaks in water pipes buried plastic. Yang et al. [12] proposed a new approach to feature extraction of the leak detection system using approximate entropy and discriminate the leakage signal from acoustic sources. Tang et al. [13] combined wavelet transform and the cross-correlation technique. Ahadi et al. [14] proposed a new method for detecting a leak in a plastic tube filled with water. Lay-Ekuakille et al. [15] proposed a comparison between two important technical filter diagonalization methods (FDM) and the impedance method used to calculate and detect leaks in pipes. In this work, we will apply the EMD in the field of detection of water leakage in distribution networks. Validation and efficiency will be investigated by applying this technique to the experimentally measured data [16]. The Data are collected by an acquisition system connected to a sensor mounted on a pipe hybrid prototype realized in the laboratory. The results obtained by this technique are compared with those obtained by the application of another detection method. The performance obtained judge the choice of the proposed method.
The EMD is the output of an iterative algorithm; it admits no analytical definition and the signal can be decomposed into different modes or IMF (Intrinsic Mode Function). An IMF is any function with the same number of extrema and zero crossings, with its envelopes being symmetric with respect to zero [2].
The procedure of extracting an IMF is called sifting. The sifting process is as follow:
1. Between each successive pair of zero crossings, identify a local extremum in the signal.
2. Connect all the local maxima by a cubic spline line as upper envelope $E_{u}(t)$
3. Repeat the procedure for the local minima to produce the lower envelope $E_{l}(t)$
4. Compute the min of the upper and lower envelope $m_{11}(t)=1 / 2\left[E_{u}(t)+E_{l}(t)\right]$
5. A candidate $h_{11}$ for the first IMF component is obtained as the difference between the signal $x(t)$ and $m_{11}(t)$.
$h_{11}(t)=x(t)-m_{11}(t)$
In a general case, the first candidate h11 does not satisfy the IMF conditions. In such a case, the sifting is repeated taking h11 as the signal. The sifting is repeated iteratively:
$h_{1 k}(t)=h_{1(k-1)}(t)-m_{1 k}(t)$ (1)
Until the assumed threshold for standard deviation (SD) computed for the two consecutive siftings is achieved. The SD is defined as
$S D=\sum_{t=0}^{T} \frac{\left|h_{1(k-1)}(t)-h_{1 k}(t)\right|^{2}}{h^{2}_{1(k-1)}(t)} $ (2)
The authors of the method suggest the SD of 0.2 -0.3 [8]. At the end of the sifting process after k iterations, the first IMF is obtained:
$c_{1}=h_{1 k}$ (3)
The c1 should contain the shortest period component of the signal. Subtracting it from the signal gives the first residue:
$r_{1}=x(t)-c_{1}$ (4)
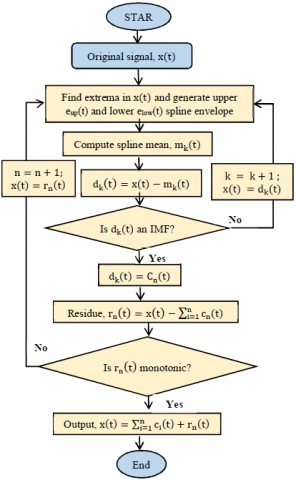
The procedure of finding consecutive IMFs can be iteratively continued until the variance of the residue is below a predefined threshold as shown by the flowchart in Figure 1.
The signal can be expressed as a sum of the empirical modes and a residue.
$x(t)=\sum_{1}^{n} c_{i}-r_{n}$ (5)
The empirical mode decomposition (EMD) is a non-linear, multiresolution and self-adaptive decomposition technique. It offers a different approach to signal processing and it is not defined as an integral transformation but is rather an empirical algorithm-based method. EMD can adaptively decompose a complicated signal into a set intrinsic mode function (IMFs), without preliminary knowledge of the nature and the number of IMF components embedded in the data. IMF function satisfies the following two conditions:
Figure 1. EMD flowchart
In this work, we applied a new algorithm based on WELSH DSP and EMD to detect and locate a leak in WDN. According to the algorithm:
To apply the techniques cited in section two, we designed and realized an adequate system formed by a hydraulic circuit linking a canal to a pumping system forming a closed circuit, and an acquisition system based on a piezoelectric sensor linked to PC via an acquisition card.
4.1 Fulfilled acquisition system
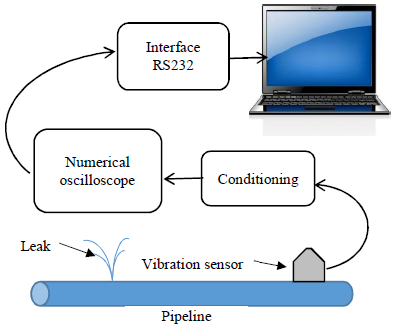
A correct signal acquisition means the correct or right analysis. For this, we realized a system that perfectly meets the measurement requirements. The vibrations generated by the leak are low-frequency signals. The canal is equipped with a piezoelectric sensor type KB12 suitable especially for low-frequency vibration measurements. Its sensitivity is 6500 ±20 pc/g, purchased from Metra Meβ. The sensor can be moved to predetermined distances with can cover our canal prototype in relation to the position of the leak that was made by making a hole of 2 mm on the metal pipe Figure 2. In addition, an electronic card performed in the laboratory for signal conditioning. The output signal is fed to a digital oscilloscope GDS1000 having a bandwidth of 2MHz. The latter has the ability to save the signals in an external memory or a direct connection to a PC via the RS232 serial port. The realized measurement system fulfills the requirements.
The collection of signals was done on time windows of 500 ms at a sampling frequency of 2 kHz.
Figure 2. Acquisition system
4.2 Hydraulic circuit
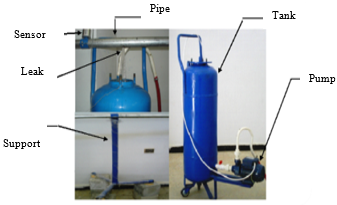
The hybrid channel used in this study is a loop 28 meters in length connected to a 150-liter tank. The line is composed of two parts of different diameters. The first is made in steel of 8 m in length and 60 mm outer diameter and 54 mm internal diameter, the other is 20 m PVC having an outer diameter of 20mm and an inner diameter of 16 mm. An electric pump provides a 15 m maximum piezometric level, and 1450 rpm as shown in Figure 3.
Figure 3. Hydraulic circuit
4.3 Treatment procedure
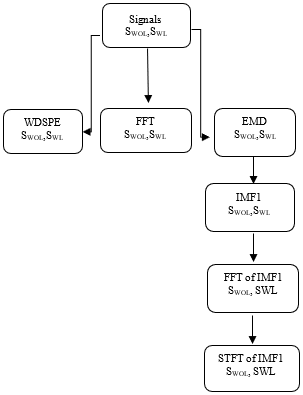
Programs are developed for the treatment of acquired signals. These last are based on conventional signal processing algorithms such as FFT, WPSDE and the EMD. The flowchart in Figure 4. depicts the step done to treat the acquired signals.
Figure 4. Processing protocol
For our study, we made acquisitions along the pipe at distances ranging from 10 cm to 4m in relation to the position of the leak and with a step of 10 cm. The analysis was done on all distances but we present the signal of 40 cm analysis as an example.
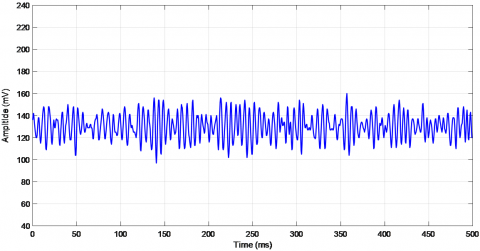
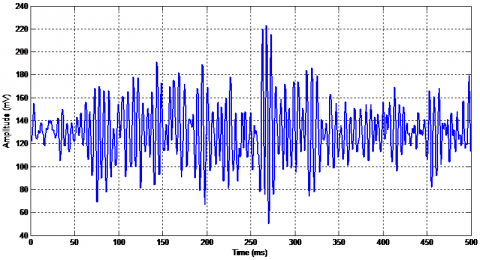
Figures 5, 6 and 7 show the temporal signals with, without leak and both with, and without leak respectively. Figure 5 and 6 depict their random nature. Although, some singular fluctuations exist in the SWL compared to the SWOL.
Figure 5 shows the fluctuations that the signal undergoes in the case of a leak. In other words, when there is a leak, leak vibration signal, i.e. signal produced by the additive thermal noise, water flow and the leak itself, propagates along the wall of the water pipeline. However, when there is not any, i.e. signal produced by the additive thermal noise and the effect of water flow, the water circulation still generates a signal but with small amplitudes. Now, when a leak occurs, water erupts from the pipeline creating a turbulent jet. As the jet hits the wall of the pipeline, it carries significant turbulent pressure fluctuation, which influences the pipeline generating a leak vibration signal, which propagates along the wall of the pipeline.
Figure 5. Signal without leak (SWOL) for d=40cm
Figure 6. Signal with a leak (SWL) for d=40cm
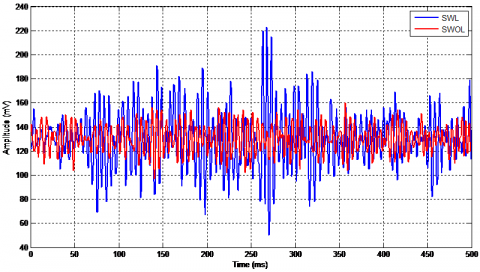
Figure 7. SWL and SWOL for a distance of d=40 cm
Figure 7 shows both signals with and without leak to display the difference between them, which can be observed clearly in the magnitude. Nevertheless, it does not confirm the presence of a leak in the channel due to interference from external vibrations sources that may affect the signal.
To affirm the detection of a leak, we will proceed to the transformation from the time domain to the frequency domain signals. Knowing approximately the channel vibration frequencies under the effect of leaks.
5.1 Useful leakage frequency band
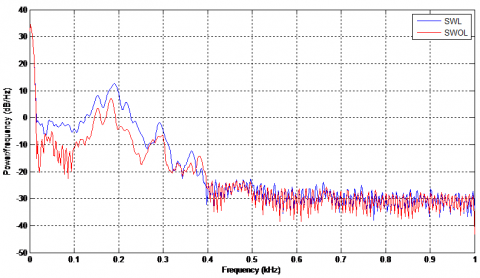
The power spectral density allows us to have an idea about the presence of a leak by comparing the signals with and without leakage. For an accurate decision of a leak, the knowledge of the frequency of vibration of the pipe generated by the latter is primordial. However, the power spectral density can reduce frequency band or leakage peaks appear. For this, we used an algorithm to calculate the WPSDE. It Estimates the power spectral density PSD of the input signal vector. Welch's method splits the data into overlapping segments, computes modified periodograms of the overlapping segments, and averages the resulting periodograms to produce the power spectral density estimate [17].
Figure 8. WPDSE of the SWL and SWOL
The power spectral density is calculated in units of power per radians per sample. The corresponding vector of frequencies f is computed in radians per sample and has the same length as WPSDE. The latter can show the difference in terms of power between the two signals SWL, SWOL and, delimits the useful frequency band. On the other hand, the FFT specifies the spectral components of the signal in this band.
Figure 8 shows a superposition of the two signals SWL, and SWOL into the upper to 400 Hz frequency range. For against, the frequency range from zero to 400 Hz has a clear difference between the density of the two signals with and without leakage or leakage can be detected.
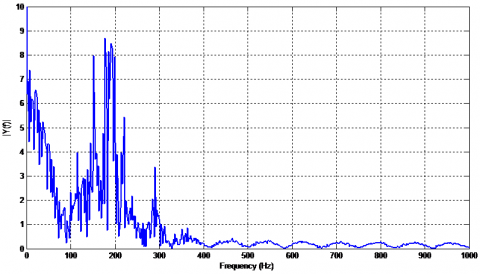
5.2 Detection by the application of the FFT
In this section, the spectra of the two signals (SWL and SWOL) obtained by applying the FFT are shown in Figure 9. Analysis of the spectra of the two signals SWL and SWOL shows that the difference between them appears in the frequency band [150-300] Hz for all distances.
The distance between the sensor position and the leak affects only the magnitude of the leakage signals and note its frequency, which is proved by several experimental measures.
In Figure 9 peaks appear in the FFT spectrum represent the junctions and hammer effect in the hydraulic circuit and leak which is around 200Hz.
(a)
(b)
Figure 9. The FFT of (a) SWOL (b) SWL
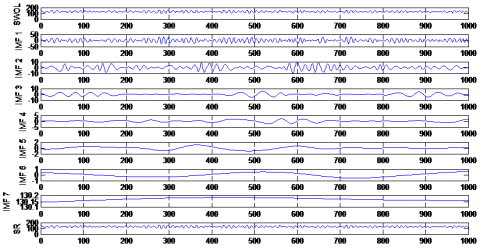
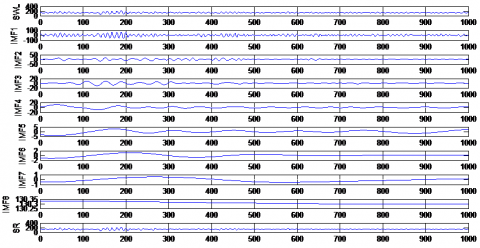
5.3 Detection by the application of the EMD
We applied the empirical modal decomposition algorithm on the two signals SWOL and SWL. After several tests, we concluded that the empirical mode decomposition could be stopped in the seventh IMFs. The latter can be considered as a noise devoid of useful information that can help us to detect leaks.
(a)
(b)
Figure 10. The EMD (a) SWOL (b) SWL
Figure 10 shows the IMFs for SWL and SWOL signals at a distance of 40 cm.
Both Figure 10. (a), and (b) show the EMD of the signals (a) SWOL (b) SWL respectively.
(a)
(b)
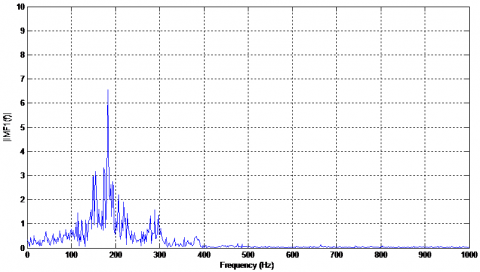
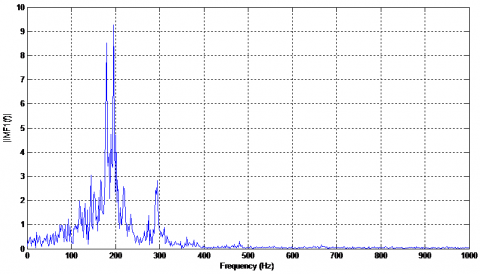
Figure 11. The FFT of IMF1 (a) SWOL, (b) SWL
(a)
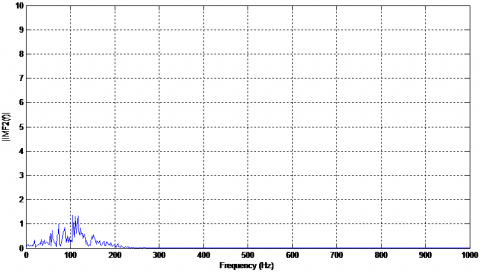
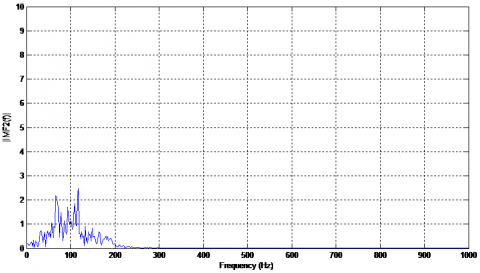
(b)
Figure 12. The FFT of IMF2 (a) SWOL, (b) SWL
In General, the amplitude of the leakage signals is always greater than a certain empirical threshold compared to the signals without leakage, which represent generally only noise. For this purpose, unwanted amplitudes, which do not contain any relevant information, are not taken into account. When analyzing with EMD we decompose the signal into several IMFS. In this case, of study, we consider only the first IMF.
The analysis of the spectrum of the IMFs in Figures 11 and 12 by applying the FFT taken separately from the SWOL and SWL signals for different distances, we can note that the leakage peaks appear clearly in the first IMF1 around 200 Hz. The other IMFs do not carry any relevant information.
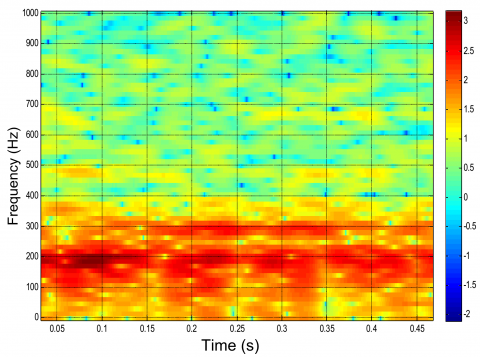
Figure 13. STFT spectrogram of SWL
The FFT spectrum permits the determination of the magnitude and frequency of the leak, which are used in the STFT spectrum to determine the time to calculate the position of the leak.
The STFT spectrogram represented in Figure 13 shows that the event which has a frequency of 200 Hz with the magnitude is around 2.5mV obtained from the FFT spectrum magnitude bar which represents the frequency of the leak has occurred at t=100 ms after the leak was triggered by the opening of the solenoid valve in our case.
We have
$X=V \times t$ (6)
where,
X : Distance between the sensor and a leak
V : propagation speed of the vibratory wave
The vibratory wave propagation in the pipeline is a key parameter to locate a leak. According to Thorley's formula (7), which is only true for single-phase fluids in rigid pipes, the propagation speed of the vibratory wave, V depends on the nature of the material and the diameter of the pipe [18, 19].
$V=\sqrt{\frac{1}{\rho\left[\frac{1}{K}+\frac{D}{E e} \emptyset\right]}}$ (7)
where,
V: Wave propagation speed, m/s
ρ: Fluid density, kg/m3
E: Young’s modulus of elasticity of pipe wall material, N/m2
K: Bulk modulus of the liquid, N/m2
ø: a restraining factor dependent on the Poisson’s ratio of the wall material and how well the pipe is supported
e: Pipe wall thickness
D: inside diameter of the pipe
t: Time obtained from the STFT spectrogram.
Applying Eq. (6), we can obtain the leak position.
This work presents a technique based on the WPDSE and the EMD to detect leaks in the water pipeline.
The empirical mode decomposition is a very recent technique specialized for analyzing nonlinear and non-stationary signals in the time domain. This technique was applied to the water distribution networks to analyze the defects that occur on these. The latter can be used to separate the relevant information’s of leaks by using IMFs’ efficiently.
The STFT was applied to locate a leak knowing leak frequency and magnitude from the FFT spectrum we can find the time, which was used to calculate the distance between the sensor and the leak.
Analysis has shown the efficacy of the chosen techniques. Unfortunately, the application was made in OFF Line that gives prospects for future work.
[1] Miloud, B. (2017). Wavelet DT method for water leak-detection using a vibration sensor: An experimental analysis. IET Signal Processing, 11(4): 396. https://doi.org/10.1049/iet-spr.2016.0113
[2] Bakhti, H., Bentoumi, M., Harrag, A., El-Hadi, K. (2019). Experimental validation of hybrid EMD-correlation acoustic digital leaks detector in water distribution network system. Instrumentation Mesure Métrologie, 18(6): 535-545. https://doi.org/10.18280/i2m.180604
[3] Ionel, R., Ionel, S., Bauer, P., Quint, F. (2014). Water leakage monitoring education: cross-correlation study via spectral whitening. IECON 2014 - 40th Annual Conference of the IEEE Industrial Electronics Society, Dallas, TX, USA. https://doi.org/10.1109/IECON.2014.7048851
[4] Taghvaei, M., Beck, S.B.M., Staszewski, W.J. (2006). Leak detection in pipelines using cepstrum analysis. Journal of Measurement Science and Technology IOP Sciences, 17(2): 367-372, https://doi.org/10.1088/0957-0233/17/2/018
[5] Lay-Ekuakille, A., Vendramin, G., Trotta, A. (2009). Robust spectral leak detection of complex pipelines using filter diagonalisation method. IEEE Sensors Journal, 9(11): 1605-1614. https://doi.org/10.1109/JSEN.2009.2027410
[6] Nasirian, A., Maghrebi, M.F., Yazdani, S. (2013). Leakage detection in water distribution network based on a new heuristic genetic algorithm model. Journal of Water Resource and Protection, 5(3): 294-303. https://doi.org /10.4236/jwarp.2013.53030
[7] Martini, A., Troncossi, M., Rivola, A. (2015). Automatic leak detection in buried plastic pipes of water supply networks by means of vibration measurements. Shock and Vibration, 2015: 165304. https://doi.org/10.1155/2015/165304
[8] Claudia Deniss, E.A., Garza, C., Eduardo, L., Adriana, V.M. (2012). Multi-leak detection with Wavelet analysis in water distribution networks. IEEE Mediterranean Conference on Control & Automation, Barcelona, Spain, pp. 1155-1160. https://doi.org/10.1109/MED .2012.6265794
[9] Cataldo, A., Cannazza, G., Benedetto, E.D. (2012). A new method for detecting leaks in underground water pipelines. IEEE Sensors Journal, 12(6): 1660-1667. https://doi.org /10.1109/JSEN.2011.2176484
[10] Feng, J., Zhang, H.G. (2004). Oil pipeline leak detection and location using double sensors pressure gradient method. Proceedings of the 5Ih World Congress on Intelligent Control and Automation (IEEE), Hangzhou, China. https://doi.org/10.1109/WCICA.2004.1343098
[11] Gao, Y., Brennan, M.J., Joseph, P.F. (2006). A comparison of time delay estimators for the detection of leak noise signals in plastic water distribution pipes. Journal of Sound and Vibration Elsevier, 292: 552-570. https://doi:10.1016/j.jsv.2005.08.014
[12] Yang, J., Wen, Y.M., Li, P. (2008). Leak acoustic detection in water distribution pipelines. Proceedings of the 7thWorld Congress on Intelligent Control and Automation (IEEE). Chongqing, China. https://doi.org/10.1109/WCICA.2008.4594487
[13] Tang, X.H., Liu, Y.B., Zheng, L.J., Ma, C.B., Wang, H. (2009). Leak detection of water pipeline using wavelet transform method. International Conference on Environmental Science and Information Application Technology (IEEE), Wuhan, China. https://doi.org/10.1109/ESIAT.2009.57
[14] Ahadi, M., Bakhtiar, M.S. (2010). Leak detection in water filled plastic pipes through the application of tuned wavelet transforms to acoustic emission signals. Applied acoustics journal Elsevier, 71(7): 634-639. https://doi.org/10.1016/j.apacoust.2010.02.006
[15] Lay-Ekuakille, A., Vergallo, P., Giannone, C. (2012). Comparison between impedance method and FDM algorithms for leak detection in urban waterworks. 9th International Multi Conference on Systems, Signals, and Devices (IEEE), Germany. https://doi.org/10.1109/SSD.2012.6198116
[16] Wang, Y.H., Yeh, C.H., Young, H.W.V., Hu, K., Lo, M.T. (2014). On the computational complexity of the empirical mode decomposition algorithm. Phisica. A Journal, 400: 159-167. https://doi.org/10.1016/j.physa.2014.01.020
[17] Zhang, L., Wu, Y.Z., Guo, L.X., Cai, P. (2013). Design implementation of leak acoustic signal correlator for water pipelines. Information Technology Journal, 12(11): 2195-2200. https://doi.org /10.3923/itj.2013.2195.2200
[18] Adnan, N.F., Ghazali, M. F., Amin, M.M., Hamat, A.M.A. (2015). Leak detection in gas pipeline by acoustic and signal processing. 3rd International Conference of Mechanical Engineering Research (ICMER 2015), Kuantan, Pahang, Malaysia. https://doi.org/10.1088/1757-899X/100/1/012013
[19] Zhang, L., Wu, Y.Z., Guo, L.X., Cai, P. (2013). Design and implementation of leak acoustic signal correlator for water pipelines. Information Technology Journal, 12(11): 2195-2200. https://doi.org/10.3923/itj.2013.2195.2200