Sirui Chen | Xiyu Qu* | Longwei Qiu | Yangchen Zhang | Tao Du
OPEN ACCESS
The type and content of lithics are of great importance to reservoir research. The existing statistical methods for lithic content mainly focus on sand-level lithics, failing to consider gravel-level lithics. Thus, these methods are not applicable to sand-conglomerate reservoirs, where sand-level and gravel-level lithics coexist. To solve the defects, this paper proposes a hybrid strategy for lithic content in sand-conglomerate reservoirs. Firstly, the type and content of gravel-level lithics were determined through full-bore formation microimager (FMI) imaging logging and core analysis. Next, the type and content of sand-level lithics were obtained by thin-section observation. On this basis, the data on the two levels of lithics were integrated to yield the total content of each type of lithics in the sand-conglomerate reservoir. The hybrid strategy was applied to analyze the lithics features and physical properties of a sand-conglomerate reservoir in the upper part of the fourth member of the Shahejie Formation (upper Es4), north zone, Dongying Depression, China. The results show that the hybrid strategy output greater upper and lower limits of the total lithic contents than the existing methods, and outshined the traditional thin-section observation in accuracy. In the study area, the sand-conglomerate reservoirs in the upper Es4 of the two blocks have different physical properties. The difference is mainly attributable to the different types and contents of lithics of the two blocks. The proposed strategy boasts a strong application potential in oil and gas exploration.
sand-conglomerate reservoir, gravel-level lithics, sand-level lithics, Dongying Depression, full-bore formation microimager (FMI); imaging logging
Lithics, i.e. fragments of parent rocks, are a mineral aggregate retaining the parent rock structure, providing a direct sign of the rock types in the sediment provenance [1]. The research on lithics sheds light on the nature of parent rocks in the provenance, the petrologic features of reservoir, maturity of composition and provenance orientation. In addition, the type and content of lithics both affect the physical behavior of the reservoir [2-5].
Currently, there are mature statistical methods to determine the content of lithics in sand-conglomerate reservoirs. The most popular approach is to observe thin sections under the microscope [6-8]. This traditional method has been widely adopted at home and abroad to quantify the lithic content in sand-conglomerate reservoirs on the steep slope of rift basins [9-12]. However, this method can only quantify the content of sand-level lithics, failing to measure that of gravel-level lithics. In fact, the two types of lithics coexist in sand-conglomerate reservoirs. To some extents, the error of the tradition method constrains the understanding of sand-conglomerate reservoirs.
With the boom of oil-gas exploration in continental rift basins, the deep-buried sand-conglomerates in the steep slope zone have become the main exploration targets [4]. The steep slope zone of rift basins lies close to the provenance and faces intense tectonic activities [13], giving birth to proximal fan, nearshore underwater fan and other types of fan. In this zone, the sand-conglomerate reservoirs form for various causes, and differ in diagenesis, diagenetic evolution and physical property development. In general, these reservoirs are of low porosity and low permeability [14].
In recent years, the exploration efforts in Shengli Oilfield, China mainly target the sand-conglomerates within the steep slope zone in the north of Dongying Depression [15, 16]. These rock masses are in lateral contact with source rocks in Shajiahe Formation, providing favorable reservoir-forming conditions. The sand-conglomerate reservoirs in the said zone have been proved to have nearly 100 million tons of oil [17].
Some scholars have conducted comparative analysis on the physical properties of the sand-conglomerate reservoir within the nearshore underwater fan in the upper part of the fourth member of the Shahejie Formation (upper Es4), which lies in the north zone of Dongying Depression, aiming to disclose how the physical properties vary with the types and contents of lithics [18]. Their studies have shown that the type and content of lithics directly bear on the diagenetic evolution, in terms of compaction, dissolution and cementation in the later phase, leading to the difference in physical properties among varied blocks of the sand-conglomerate reservoir. In addition, the preferable conditions for physical properties in the sand-conglomerate reservoir were summed up as high content of metamorphic lithics, low content of carbonatite lithics, and low calcification of formation water. The above studies confirm the impacts of the type and content of lithics on the physical properties of the sand-conglomerate reservoir [19-24].
In light of the above, this paper puts forward a hybrid strategy to quantify the content of each type of lithics in the sand-conglomerate reservoir. Firstly, the contents of gravel-level and sand-level lithics in the reservoir were quantified both on the macroscale and the microscale. Next, the two contents were combined to measure the content of each type of lithics in the reservoir. The hybrid strategy eliminates the error of the traditional statistical method in petrology, and boasts a strong application potential in reservoir studies.
The main statistical methods for lithic content include imaging logging, core analysis and thin-section observation. The three methods are often used separately or in pairs.
Imaging logging has been extensively applied to oil-gas exploration. For instance, Yan et al. [25] analyzed the features of sand-conglomerates with different lithologies and sedimentary features, using images captured by a full-bore formation microimager (FMI). These images provide more useful information than conventional logging images. Khoshbakht et al. [26, 27] pinpointed the orientation, depth and type of natural fractures in reservoirs through imaging logging, which incurs lower cost yet provides more complete data than core analysis. Fan et al. [28] combined imaging logging and apparent resistivity atlas of formation water to identify the fluid type in the carbonate reservoir, which overcomes the high heterogeneity and weak logging response of the fluid. However, the combined method only applies to formations with low pyrite contents, i.e. the drilling fluid should have a similar salinity with formation water. Movahed Zohreh et al. [29] evaluated the drilling risk of wells, especially the borehole failure, through imaging logging, but the borehole morphology was not observed with enough accuracy. Facing the lack of data on outcrops, cores or thin sections, Nian et al. [30] elaborated the sedimentary features of a braided delta, and deduced the paleocurrent direction through high-quality imaging logging. Nonetheless, the paleocurrent direction cannot be determined accurately without considering the regional tectonic setting. Sofia Alves Fornero et al. [31] established a formation model of historical volcanic activities in Santos Basin, Brazil, based on acoustic imaging logging and geochemical analysis. Their research lays the foundation for evaluating volcanic rock reservoir and modelling the geology in the area. Of course, seismic data must be included to achieve reliable geologic modelling. Massiot et al. [32] investigated lithofacies features of the volcanic rock reservoirs in Taupo volcanic zone, using acoustic imaging logging. The lithofacies features were explained excellently with a much lower cost than core drilling.
Similarly, core analysis and thin-section observation have also been adopted frequently in oil exploration. For example, Cao et al. [33] quantified the structural features of clastic particles in the sand-conglomerate reservoir, coupling the macroscale analysis on refined core images and the microscale observation of thin sections, summed up the combined features of multiple lithofacies, and used them in provenance analysis. Through sectioning, polishing and scanning, Yang et al. [34] obtained high-resolution scanned color images of cores, relied on the images to compute the diameter and rounding of each gravel, and then solved the gravel parameters like sorting coefficient and distribution, considering the sedimentary setting. Nonetheless, their methods consumed a long time and heavy labor to recognize all gravel-level lithics.
In the existing studies, imaging logging has been widely adopted to facilitate oil-gas exploration, but not to analyze the petrologic features of sand-conglomerate reservoir with certain limitations. Imaging logging can reflect the lithological changes in the reservoir, but cannot differentiate between different types of gravel-level lithics. Core analysis can determine the type and content of gravel-level lithics on the macroscale, failing to quantify the fine sand-level lithics. On the contrary, thin section observation is not suitable to quantify gravel-level lithics on the macroscale.
Therefore, this paper integrates the FMI imaging logging, core analysis and thin-section observation into a hybrid strategy to quantify the lithic content in the sand-conglomerate reservoir. Firstly, the gravel-level lithic content was quantified through imaging logging. Then, the statistics of core analysis and thin-section observation were utilized to derive the content of each type of lithics in the sand-conglomerate reservoir. Furthermore, a computer program was developed to reduce the time to compute the gravel-level lithic content.
The remainder of the paper is organized as follows: Section 3 details the hybrid strategy for determining the lithic content in the sand-conglomerate reservoir; Section 4 applies the hybrid strategy in actual work areas and discusses the statistical results; Section 5 puts forward the research conclusions.
3.1 FMI imaging logging
FMI imaging logging is a technique that characterizes geological phenomena with image features. Through FMI imaging logging, the change factors of resistivity on borehole walls can be described accurately. The FMI log usually contains four colors (i.e. black, brown, yellow and white). From dark to light, the colors are divided into 42 levels, according to the resistivity value [21]. With poor electrical conductivity, gravels leave bright spots on the FMI log, forming a sharp contrast against the background. Hence, the gravel-level lithic content in the target depth section can be derived based on the information extracted from the FMI log.
3.1.1 Preprocessing of FMI log
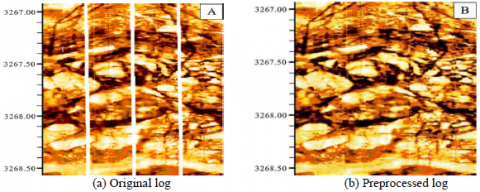
The data for imaging logging were firstly acquired for the target depth section in the study area. During FMI imaging, the dead zones created by plates will leave blank stripes on the final log. To eliminate these stripes, the FMI log of the entire wellbore was preprocessed by CIFLog2.1 logging software. Besides removing the stripes, the preprocessing smoothed the log without losing any information on gravel-level lithics (Figure 1).
3.1.2 Recognition of gravel-level lithics
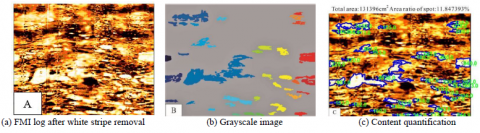
With low gamma, low potassium content and high thorium content, gravel-level lithics often exist as bright white or bright yellow spots on logging images. Here, the gravel-level lithics on the FMI log are recognized through the following steps. First, a self-developed computer program was run on Matlab to quantify the gravel-level lithic content in the preprocessed FMI image. The FMI color log was read as an image file, and converted to a grayscale image. The conversion greatly reduces the computing load to process the color log, without sacrificing the local/global chroma or brightness. Second, the grayscale image was transformed into a binary image based on brightness. Third, the pixels smaller than 100 were removed from the image, and the boundaries of each bright spot were marked. Fourth, the boundaries and gravity center of each bright spot were determined, the boundary coordinates (x, y) of each spot were computed, and the area of each spot was calculated. Fifth, the area of each spot was displayed at its gravity center, while the total area of all spots and the area ratio of bright spots to the entire log were also presented. This ratio represents the percentage content of gravel-level lithics at the target depth section (Figure 2).
Figure 1. Log preprocessing
Figure 2. Recognition of gravel-level lithics
3.2 Core analysis
The author selected a typical core section that matches the FMI log. The types of all gravel-level lithics were determined by observing the core. Then, the particle size of gravel-level lithics was measured and counted manually. The area percentage of each type of gravel-level lithics was obtained from the core. Finally, the macroscale lithic content was determined based on the area percentage of gravel-level lithics recognized on the FMI log.
3.2.1 Manual measurement of gravel-level lithics
After the types of lithics were determined, the lithics greater than 2mm in particle size were measured manually. The measurement was performed by different criteria for lithics of different morphologies.
Figure 3. The core sample and its gravel-level lithics
If a lithic is a long stripe or has an obvious length difference between major and minor axes, the major axis length and minor axis length were measured separately. Then, the lithic was treated as an ellipse, and its area was approximated by S ellipse=πab (Figure 3), where a is half the length of the major axis (mm) and b is half the length of the minor axis (mm).
If a lithic only has a slight length difference between major and minor axes, it was treated as a circle and its area was approximated by Scircle=πR2, where R is the circle radius (mm).
3.2.2 Quantification of each type of gravel-level lithics
It is assumed that the core sample contains four types of gravel-level lithics (A, B, C & D) (Figure 3b). Type A lithics were cited to explain the quantification of gravel-level lithic content.
According to the abovementioned criteria, if a lithic has an obvious length difference between major and minor axes, the major axis length and minor axis length were measured separately as a1 and b1. Then, the lithic area was approximated as S lithic (ellipse) A1=πa1b1. The area approximation of a lithic with a slight length difference between major and minor axes is omitted here.
Let k be the number of type A lithics with an obvious length difference between major and minor axes, ai(i=1~k) be their major axis lengths, and bi(i=1~k) be their minor axis lengths. Then, the total area of these type A lithics was computed by S (ellipse) lithics A (total)= ∑Si(ellipse) lithics A (i=1~k).
Similarly, let m be the number of type A lithics with a slight length difference between major and minor axes, and Ri(i=1~m) be their approximate radii. Then, the total area of these type A lithics was computed by S(circle)lithics A (total) =∑Si(circle)lithics A πR2 (i=1~m).
On this basis, the total area of type A gravel-level lithics was obtained by S lithics A (total)= S(ellipse) lithics A (total)+S (circle) lithics A(total).
The above process was repeated to obtain the total area of each of the other three types of gravel-level lithics.
After that, the total areas of the four types of gravel-level lithics were added up to yield the total area of all gravel-level lithics in the core sample, denoted as Slithics (total).
Next, the total area of each type of gravel-level lithics was divided by the total area of all gravel-level lithics, yielding the area percentage of each type of gravel-level lithics: Q(gravel level) lithics A%=S lithics A (total)/S lithics (total).
Type A lithics were still taken as the example to illustrate how to compute the final percentage content of each type of gravel-level lithics. This value was calculated by multiplying the area ratio of bright spots to the entire log (N gravel (total)), which was determined in the previous subsection, and the area percentage of type A gravel-level lithics Q(gravel level) lithics A%: M(gravel level) lithics (A)%=Q lithics A%×N lithics (total)%.
3.3 Thin-section observation
Sand-level lithics were taken from the core sample and prepared into a thin section. Then, the different types of sand-level lithics were identified on the microscale under a polarizing microscope. Next, the skeleton particles on the thin section were quantified by the following method.
First, a measuring line was drawn, whose length is twice the mean particle size of the observed skeleton particles. Second, any sand-level skeleton particle intersecting with the line was treated as a point. Third, 300 to 500 points were counted and the quantity ratio of each type of sand-level lithics was taken as their volume ratio.
Considering the four types of sand-level lithics (A, B, C & D), it is assumed that k (k≈300) sand-level lithics were counted by the above method, including m type A lithics, n type B lithics, p type C lithics and s type D lithics. Then, the number of each type of sand-level lithics was divided by the total number of all sand-level lithics, yielding the percentage content of each type of sand-level lithics, denoted as W(sand level) lithics i% (i=A~D).
Taking type A sand-level lithics as example, the percentage content can be computed by: W(sand level) lithics A%=m(sand level) lithics A (quantity) /k (sand level) total lithics particles (quantity).
The percentage contents of type B~D sand-level lithics were computed in the same manner.
3.4 Finalization of lithic contents
Based on the above three methods, the macroscale content of gravel-level lithics and the microscale content of sand-level lithics were combined to derive the total content of each type of lithics at the target depth section in the sand-conglomerate reservoir.
Taking type A lithics for example, the percentage content of this type of lithics at the target depth section of the reservoir was obtained by adding up the percentage content of type A gravel-level lithics and that of type A sand-level lithics: H lithics A%=M (gravel level) lithics A%+W (sand level) lithics A%.
4.1 Case study
To verify its effectiveness, the proposed hybrid strategy was applied to Yanjia 22-22 well, Yong’an 930 well, and Yong’an 559 well in Yanjia and Yong’an blocks, which are in the north of Dongying Depression. The FMI logs were provided by Research Institute of Exploration and Development, Shengli Oilfield. The core sample was collected from the drill core store of Shengli Oilfield. The target formation was the upper Es4.
4.1.1 Geological background
Located in the east part of the north steep slope of Dingying Depression, the study area is a steep slope tectonic zone controlled by Chennan Fault, a fault with shovel-like sector boundaries. As shown in Figure 4, the study area is bordered by Chenjiazhuang Salient in the north, Shengtuo Oilfield in the west, Qingtuozi in the east, and Minfeng Sub-sag in the south.
Due to two west-east trending paleo gullies, the ancient landform is featured by high mountains, steep slopes and the alternation between gullies and ridges [17]. During the sedimentation period of upper Es4, seasonal flood carried a huge number of coarse fragments into the lake under the said ancient tectonic setting. As a result, the fracture surface of the study area has many sand-conglomerates, which were developed in multiple phases within the nearshore underwater fan [18].
According to sedimentary features and hydrodynamic conditions, the nearshore underwater fan was divided into three parts: root, middle, and edge. The root part lies the main water channel, which is dominated by matrix-supported conglomerates. The middle part includes braided channels and their intervals. The former is dominated by gravelly sandstone, pebbly sandstone and multi-layered scoured coarse sandstone, while the latter by typical turbidites. The edge part mainly consists of dark gray mudstones interbedded with flagstones and pebbly sandstones [20].
Figure 4. Tectonic map of the study area [20]
The study area has seen great breakthroughs in the oil–gas exploration in the sand-conglomerates within the nearshore underwater fan of the upper Es4 [20]. Nevertheless, the diagenesis and reservoir-forming laws of the sand-conglomerate reservoir in the study area are rather complex, for the sand-conglomerates went through multiphase cementation, dissolution, complicated metasomatism and multiphase oil and gas charging.
4.1.2 FMI imaging logging
For accuracy, 1m-long target depth sections were selected from the FMI image to cover the sampling depths of the cores. For instance, the cores in Figures 5 and 6 were sampled at the depths of 3,691.35m and 3,797.55m, respectively. Thus, 3,691~3,692m and 3,797~3,798m were selected from the FMI image as the target depth sections. Several wells were selected from the study area to explain the quantification results (Table 1).
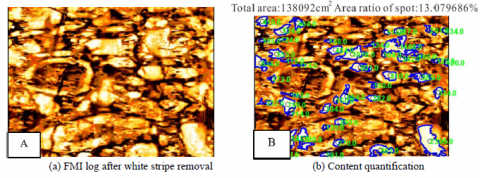
Figure 5. Quantification of gravel-level lithics at 3,691~3,692m in Yanjia 22-22 well
Figure 6. Quantification of gravel-level lithics at 3,797~3,798m in Yong’an 930 well
Table 1. Quantification results of gravel-level lithic content
|
Well |
Depth |
Top depth |
Bottom depth |
Result |
|
Yanjia 22-22 |
3,691.25 m |
3,691 m |
3,692 m |
7.48% |
|
3,692 m |
3,693 m |
3,692.45 m |
7.46% |
|
|
Yong’an 930 |
3,681.25 m |
3,681 m |
3,682 m |
9.03% |
|
3,797.95 m |
3,797 m |
3,798 m |
13.07% |
|
|
3,864.6 m |
3,864 m |
3,865 m |
13.71% |
|
|
3,996 m |
3,995.5 m |
3,996.5 m |
13.16% |
|
|
Yong’an 559 |
3,226 m |
3,225.5 m |
3,226.5 m |
13.75% |
|
3,226.45 m |
3,226.5 m |
3,227.5 m |
18.15% |
|
|
3,325.8 m |
3,325 m |
3,326 m |
11.84% |
In Yanjia block, the gravel-level lithic contents of Yanjia 22-22 well were 7.48 % and 7.46 %, respectively, at 3,691~3,692 m and 3,797~3,798 m.
In Yong’an block, the gravel-level lithic contents of Yong’an 930 well were 9.03 %, 13.07 %, 13.71 %, and 13.16 %, respectively, at 3,681~3,682 m, 3,797~3,798 m, 3,864~3,865 m and 3,995.5~3,996.5 m; the gravel-level lithic contents of Yong’an 559 well were 13.75 %, 18.15%, and 11.84 %, respectively, in 3,225.5~3,226.5 m, 3,226.5~3,227.5m, and 3,325~3,326 m.
Overall, the gravel-level lithics content in Yanjia block is lower than that of Yong’an block.
Figure 7. Classification of sand-level lithics of upper Es4 in the study area
Table 2. Sand-level lithic contents of upper Es4 in the study area (part)
|
Work area |
Well |
Depth |
Category |
Silicalite lithics |
Carbonatite lithics |
Granite lithics |
Mudstone lithics |
Acid extrusive rock lithics |
Phyllite lithics |
Sandstone lithics |
Granitic gneiss lithics |
Number of lithics |
Number of skeleton particles |
Total lithic content |
|
Yanjia block |
Yanjia 22-22 |
3,691.35m |
Gravel-level lithics |
1.39% |
4.13% |
|
0.98% |
|
|
|
2.96% |
|
|
56.24% |
|
Sand-level lithics |
7.82% |
18.58% |
|
2.38% |
1.11% |
1.22% |
|
15.67% |
224 |
318 |
||||
|
3,692.45 m |
Gravel-level lithics |
1.08% |
3.11% |
|
0.47% |
|
|
|
|
|
|
33.83% |
||
|
Sand-level lithics |
6.49% |
3.19% |
2% |
1.66% |
0.45% |
|
1.33% |
11.73% |
204 |
301 |
||||
|
Yong'an block |
Yong’an 559 |
3,226 m |
Gravel-level lithics |
8.42% |
|
2.43% |
0.22% |
|
|
|
7.06% |
|
|
|
|
Sand-level lithics |
13.96% |
2.53% |
4.45% |
|
0.64% |
|
0.67% |
28.89% |
160 |
315 |
68.94% |
|||
|
3,226.45 m |
Gravel-level lithics |
14.09% |
|
2.39% |
0.38% |
|
|
|
1.28% |
|
|
|
||
|
Sand-level lithics |
18.15% |
2.23% |
4.45% |
|
1.33% |
|
|
24.52% |
163 |
325 |
68.35% |
4.1.3 Core analysis
Considering the percentage content of gravel-level lithics, the core samples were analyzed according to the abovementioned method. The lithics greater than 2mm in particle size were identified, measured and counted manually. Yanjia 22-22 well and Yong’an 559 well were cited to explain the results.
As shown in Table 2, four types of gravel-level lithics were identified in the core sample collected in 3,691~3,693m of Yanjia 22-22 well, namely, carbonatite lithics (mean content: 3.62 %), silicalite lithics (mean content: 1.24 %), granitic gneiss lithics (mean content: 2.88 %) and mudstone lithics (mean content: 0.73 %). Meanwhile, three types of gravel-level lithics were identified in the core sample collected in 3,226~3,227 m of Yong’an 559 well, including silicalite lithics (mean content: 11.26 %), granite lithics (mean content: 2.41 %) and mudstone lithics (mean content: 0.31 %).
4.1.4 Thin-section observation
The traditional thin-section method was adopted to quantify the sand-level lithics. Through thin-section observation, the types of sand-level lithics in the core samples were determined, and then the sand-level lithics of upper Es4 in the study area were divided into 8 subclasses under 3 classes.
The three classes are sedimentary lithics, magmatic lithics and metamorphic lithics. The sedimentary lithics include mudstone lithics, carbonatite lithics (limestone and dolomite) and sandstone lithics (Figures 7a, b, e and h). The magmatic lithics include granite lithics and acid extrusive rock lithics (Figures 7c and f). The metamorphic lithics include metaquartzite lithics, granitic gneiss lithics and phyllite lithics (Figures 7d, o and i).
Next, the sand-level lithic contents were quantified. As shown in Table 2, the main types of sand-level lithics in 3,691~3,693m of Yanjia 22-22 well include: silicalite lithics (mean content: 7.16 %), carbonatite lithics (mean content: 10.89 %), granitic gneiss lithics (mean content: 13.7 %), and mudstone lithics (mean content: 2.02 %), while the other types of sand-level lithics were so few as negligible. The main types of sand-level lithics in 3,226~3,227 m of Yong’an 559 well include: silicalite lithics (mean content: 16.06 %), carbonatite lithics (mean content: 2.83 %), granite lithics (mean content: 4.45 %) and granitic gneiss lithics (mean content: 26.71 %), while the other types of sand-level lithics were so few as negligible.
4.2 Results analysis
4.2.1 Analysis on the final lithic contents
For each target depth section in a single well, the actual content of each type of lithics was obtained by adding up the corresponding gravel-level lithic content on the macroscale and gravel-level lithic content on the microscale.
The two blocks in the study area were compared in light of the statistical results. In terms of gravel-level lithics, Yanjia block has lower contents of silicalite lithics, granite lithics and granitic gneiss lithics than Yong’an block, and a similar content of mudstone lithics with the latter.
In terms of sand-level lithics, both blocks are rich in slicalite lithics and granitic gneiss lithics, and differ slightly in their contents. The two blocks have a great difference in the content of carbonatite lithics. The other types of lithics have very low presence in both blocks.
Table 3. Comparison with previous studies
|
Work area |
Formation |
Total lithic content |
Sources |
|
|
Our results |
Previous results |
|||
|
Yanjia block |
Upper Es4 |
34.74%–73.15% |
25%~55% |
Reference [19] |
|
23.25%~36.08% |
Reference [20] |
|||
|
Approximately 34% |
Reference [22] |
|||
|
Yong’an block |
49.8%–69.22% |
15%~35% |
Reference [15] |
|
|
8%~45% |
Reference [24] |
|||
By the hybrid strategy, the lithics data of both work areas were integrated to obtain the total lithic content in each block of upper Es4 in the study area: 34.64 %~73.15 % in Yanjia block and 49.8~69.22 % in Yong’an block (Table 3). The upper and lower limits of the total lithic contents were greater than those in previous studies, revealing that our results are more accurate than the previous ones.
4.2.2 Effects of lithic contents on physical properties of sand-conglomerate reservoir
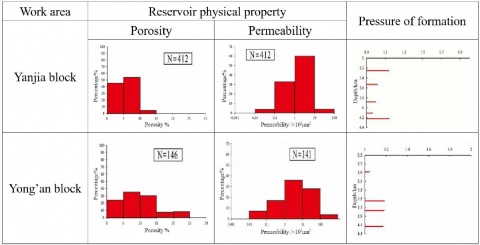
The physical properties of Yanjia and Yong’an blocks in upper Es4 were summed up as follows: In Yanjia block, the porosity falls in 0.4 %~13.4 % (mean: 5.27 %), and the permeability falls in 0.02~45.55×102μm2 (mean: 2.04 %); In Yong’an block, the porosity falls in 1.7 %~23.2 % (mean: 8.95 %), and the permeability falls in 0.03~550.491×102μm2 (mean: 20.23 %).
According to the physical property distribution histograms of the two blocks (Figure 8), the upper Es4 reservoirs in Yanjia block have extra-low porosity and permeability or ultra-low porosity and permeability, for the porosity and permeability in that formation mainly concentrate in 0 %~10 % and 0.1~10×102μm2, respectively; the upper Es4 reservoirs in Yong’an block have low porosity and low or medium permeability, or extra-low porosity and ultra-low permeability, for the for the porosity and permeability in that formation mainly concentrate in 5 %~15 % and 1~100×102μm2, respectively. Overall, Yong’an block has better physical properties than Yanjia block in upper Es4.
Although both are in the east part of the northern Dongying Depression, the two blocks differ greatly in the reservoir properties at the same formation. Below is an analysis on the causes of the difference.
First, the contents of interstitial materials in upper Es4 of the two blocks were sorted out. The interstitial material content in upper Es4 of Yanjia block falls in 0~33 % (mean: 5.38 %), while that of Yong’an block falls in 0~36 % (mean: 11.65 %).
Next, all the lithics were divided into rigid ones and plastic ones. The rigid lithics include silicalite lithics, granite lithics and granitic gneiss lithics, while plastic lithics cover carbonatite lithics and mudstone lithics. Based on our results on lithic contents, the mean content of rigid lithics in upper Es4 was 53.9 % and 23.96 % in Yanjia and Yong’an blocks, respectively, the mean content of plastic lithics in upper Es4 was 12.24 % and 20.41 %, in Yanjia and Yong’an blocks, respectively.
Third, the formation pressure data in upper Es4 of the study area were collated. The results show that the upper Es4 pressure coefficient falls in 0.96~1.13 in Yanjia block and in 1.04~1.18 in Yong’an block. The intervals indicate that the upper Es4 is under normal pressure in both blocks.
The above data show that Yangjia block has a lower content of interstitial materials than Yong’an block. In both blocks, the upper Es4 pressures are in the normal range, i.e. the target formation is not over pressurized.
On the type and content of lithics, the upper Es4 in Yanjia block has similar contents of rigid and plastic lithics, while that in Yong’an block has far more rigid lithics than plastic ones.
Besides, the target formation in Yong’an block has a much higher content of rigid lithics and a lower content of plastic content than that in Yanjia block.
Therefore, the poor physical properties of the upper Es4 in Yanjia block are attributable to the low content of rigid lithics and the high content of plastic lithics. Under the dominance of plastic lithics, the reservoir is greatly affected by later-phase compaction. In this case, the primary pores cannot be well preserved, and the fluid has difficulty in entering pores to form secondary corrosive pores.
The good physical properties of the upper Es4 in Yong’an block come from the dominance of rigid lithics over plastic lithics in that block. This lithic pattern ensures the anti-compaction ability of the reservoir, protects the primary pores, and promotes corrosion.
In addition, the above results indicate that the anti-compaction and pore preservation effects of rigid lithics are more powerful than the porosity reduction effect of cementation.
Figure 8. Physical properties of upper Es4 sand-conglomerate reservoir in the study area
To overcome the defects of the traditional statistical methods for lithic content in sand-conglomerate reservoir, this paper designs a hybrid strategy coupling imaging logging, core analysis and thin-section observation, applies the strategy to quantify the lithic contents in sand-conglomerate reservoir of two blocks in an oilfield, and explains the difference in physical properties between the two blocks. The main conclusions are as follows:
(1) The proposed hybrid strategy provided a more detailed classification of lithics, and output greater upper and lower limits of the total lithic contents than the existing methods.
(2) In Yanjia block, the most common types of lithics are carbonatite lithics and granitic gneiss lithics, followed by silicalite lithics. In Yong’an block, the most common types of lithics are silicalite lithics and granitic gneiss lithics, followed by carbonatite lithics and granite lithics.
(3) The sand-conglomerate reservoirs in the upper Es4 of the two blocks have different physical properties. The difference is mainly attributable to the different types and contents of lithics of the two blocks. In Yong’an block, the dominance of rigid lithics over plastic ones protects the primary pores and facilitates fluid-rock interaction. In Yanjia block, the relatively low content of plastic lithics makes it difficult to preserve the primary pores or form secondary pores.
In future research, the speed and computing load of the hybrid strategy will be further improved, and the accuracy of the self-designed computer program will be enhanced.
The research is supported by the National Science and Technology Major Project of China (Grant No.: 2017ZX05072-002; 2017ZX05009-002), Graduate Innovation Project of China University of Petroleum (East China) (Grant No.: YCX2019010), and Sinopec Shengli Oilfield Co., Ltd.
[1] Qiu, L.W., Mu, X. J., Li, H., Zhang, J., Ge, J., Xu, S., Zhou, S.B. (2019). Characteristics of detritus development in the Permian lower Shihezi Formation in Hangjinqi area and its influence on reservoir physical properties. Oil & Gas Geology, 40(1): 24-33. http://doi.org/10.11743/ogg20190103
[2] Zhang, L.Q., Yang, W. (2012). Multi-provenance depositional model of paleo gully in north steep slope of Dongying depression of upper Es 4 in Paleogene. Journal of Central South University (Science and Technology), 43(8): 3159-3165. http://doi.org/10.1353/jji.2012.0030
[3] Wang, G.M., Zhang, J., Wang, Q.B., Li, L. (2018). Factors controlling medium-to-deep coarse siliciclastic reservoirs of high quality at the southeastern margin of Qinnan Sag, Bohai Bay Basin, China. Oil & Gas Geology, 39(2): 330-339. http://doi.org/10.11743/ogg20180212
[4] Cao, Y.C., Cheng, X., Wang, Y.Z., Ma, B.B. (2015). Diagenesis of paleogene glutenite reservoir and its control on physical property in the north zone of chezhen sag. Acta Sedimentologica Sinica, 33(6): 1192-1203. http://doi.org/10.14027/j.cnki.cjxb.2015.06.012
[5] Zhou, Z.H., Zhong, D.K., Fan, R.,Wang, A., Tang, Z.C., Sun, H.T., Wang, W., Du, H.Q. (2019). Effect of dissolution of rock fragments and its associated cementation on pore evolution: A case study of the lower Sub - member of the second member of Xujiahe formation in the west of Yuanba area, northeastern Sichuan basin. Journal of China University of Mining & Technology, 48(3): 592-603, 615. http://doi.org/10.13247/j.cnki.jcumt.000957
[6] Smlim, A.M.A., Umar, A.A.B., Mahat, S.Q.A., Hakimi, M.H., Al-hasani, A., Ahmed, A.A., Saaid, I.M. (2018). Reservoir characteristics of the Kuhlan sandstones from Habban oilfield in the Sabatayn Basin, Yemen and their relevance to reservoir rock quality and petroleum accumulation. Journal of African Earth Sciences, 145(9): 131-147. http://doi.org/10.1016/j.jafrearsci.2018.05.013
[7] Maraschin, A.J., Georgiana, F.C., Martins, L.L., Severiano, R., Hélio, J.P., Augustin, A.H. (2019). Relationship between diagenesis and the emplacement of bitumen in the Lower Triassic Piramboia Formation sandstones, Paraná Basin, SW Brazil. Journal of South American Earth Sciences, 92(6): 435-447. https://doi.org/10.1016/j.jsames.2019.03.029
[8] Poursoltani, M.R., Gibling, M.R., Pe-Piper, G. (2019). Diagenesis, burial history, and hydrocarbon potential of Cambrian sandstone in the northern continental margin of Gondwana: A case study of the Lalun Formation of central Iran. Journal of Asian Earth Sciences, 172(4): 143-169. https://doi.org/10.1016/j.jseaes.2018.09.003
[9] Wei, W., Zhu, X.M., Tan, M.Y., Xue, M.G., Guo, D.B., Su, H., Wang, P.Y. (2015). Diagenetic and porosity evolution of conglomerate sandstones in Bayingebi Formation of the Lower Cretaceous, Chagan Sag, China-Mongolia frontier area. Marine and Petroleum Geology, 66(9): 998-1012. https://doi.org/10.1016/j.marpetgeo.2015.08.011
[10] Mahmic, O., Dypvik, H., Hammer, E. (2018). Diagenetic influence on reservoir quality evolution, examples from Triassic conglomerates/arenites in the Edvard Grieg field Norwegian North Sea. Marine and Petroleum Geology, 93(5): 247-271. https://doi.org/10.1016/j.marpetgeo.2018.03.006
[11] Yan, J.P., Fan, J., Wang, M., Li, Z.Z., Hu, Q.H.,Chao, J. (2018). Rock fabric and pore structure of the Shahejie sandy conglomerates from the Dongying depression in the Bohai Bay Basin, East China. Marine and Petroleum Geology, 97(11): 624-638. https://doi.org/10.1016/j.marpetgeo.2018.07.009
[12] Sousa, A.D., Carvalho, G., Ros, L.F.D. (2015). Diagenesis of Aptian sandstones and conglomerates of the Campos Basin. Journal of Petroleum Science and Engineering, 125(1): 189-200. http://dx.doi.org/10.1016/j.petrol.2014.11.019
[13] Jia, H.B., Ji, H.C., Wang, L.S., Gao, Y., Li, X.W., Zhou H. (2017). Reservoir quality variations within a conglomeratic fan-delta system in the Mahu sag, northwestern Junggar Basin: Characteristics and controlling factors. Journal of Petroleum Science and Engineering, 152(4): 165-181. http://dx.doi.org/10.1016/j.petrol.2017.03.002
[14] Obrist-Farner, J., Yang, W. (2017). Provenance and depositional conditions of fluvial conglomerates and sandstones and their controlling processes in a rift setting, mid-Permian lower and upper Quanzijie low order cycles, Bogda Mountains, NW China. Journal of Asian Earth Sciences, 138(5): 317-340. http://dx.doi.org/10.1016/j.jseaes.2017.02.020
[15] Zhang, L.Q., Luo, X.R., Mu, Y.Y., Gao, Y.M., Zhang, M., Luo, H.M. (2013). Distribution characteristics of carbonate cement of nearshore subaqueous fans in Upper Es 4 of paleogene of Dongying depression. Journal of China University of Petroleum, 37(3): 1-7. http://doi.org/10.3969/j.issn.1673-5005.2013.03.001
[16] Cao, G., Wang, X.X., Zhu, X.M., Qu, Q.G., Wu, C.B.J., He, J.C., Dai, B.Y. (2016). Diagenetic Evolution of Es3x nearshore subaqueous fan reservoir and its influence on property in the steep slope zone of Western Chezhen sub-sag. Acta Sedimentologica Sinica, 34(1): 158-167. http://doi.org/10.14027/j.cnki.cjxb.2016.01.015
[17] Wang, Y.S., Wang, Y., Zhu, D.S., Ding, J.H., Shang, B., Zhu, J.J. (2016). Genetic mechanism of high-quality glutenite reservoirs at the steep slope in northern Dongying sag. China Petroleum Exploration, 21(2): 28-36. http://doi.org/0.3969/j.issn.1672-7703.2016.02.004
[18] Wang, Y.Z., Cao, Y.C., Li, Y.X. (2010). Comparative analysis on sand-conglomerate physical properties of the nearshore subaqueous fan of upper Es4, north belt of Dongying depression. Petroleum Geology and Recovery Efficiency, 17(4): 9-12, 111-11. http://doi.org/10.13673/j.cnki.cn37-1359/te.2010.04.026
[19] Zheng, D.S., Zhou, L., Cheng, Y.,Xu, G.H., Zhang, H. (2013). Characteristics of the glutenite reservoir in upper Es 4 of Yanjia area in the north steep slope of Dongying depression. Special Oil & Gas Reservoirs, 20(5): 24-27, 152. http://doi.org/10.3969/j.issn.1006-6535.2013.05.005
[20] Ma, B.B., Cao, Y.C., Wang, Y.Z., Liu, H.M. (2015). Relationship between lithofacies and physical properties of sandy conglomerate reservoirs of Es4s In Yanjia Area, Dongying Depression. Journal of Jilin University (Earth Science Edition), 45(2): 495-506. http://doi.org/10.13278/j.cnki.jjuese.201502113
[21] Yuan, R., Zhu, R., Qu, J.H., Zhang, L. Wu, J., Wang, Z.L., Pan, J. (2018). Division method of double property lithofacies based on microresistivity imaging logs: A case study of Baik-ouquan formation in Mahu sag, Junggar basin. Journal of Northeast Petroleum University, 42(1): 14-23, 121-122. http://doi.org/10.3969/j.issn.2095-4107.2018.01.002
[22] Zhang, Q. (2008). Reservoir characteristics and effective reservoir identification in upper Sha4 member of Yan222 block, Dongying Depression. Petroleum Geology and Recovery Efficiency, 2008, 15(4): 33-35, 38, 1. http://doi.org/10.13673/j.cnki.cn37-1359/te.2008.04.010
[23] Dong, Z.R., Zhang, J.L., Li, D.Y. (2010). Diagenesis and pore evolution of the upper fourth member of Sha Hejie formation of Yanjia Area. Periodical of Ocean University of China, 40(12): 135-140. http://doi.org/10.16441/j.cnki.hdxb.2010.12.021
[24] Cao, G., Zhou, J.Y., Qu, Q.G., Hou, J.G. (2016). Controlling factors of effective reservoirs in glutenite body of the fourth member of Shahejie Formation in Yong 1 block, Dongying Sag. Lithologic Reservoirs, 28(1): 30-37, 64. http://doi.org/10.3969/j.issn.1673-8926.2016.01.004
[25] Yan, J.P., Cai, J.G., Zhao, M.H., Li, Z.Z., Xu, G.H. (2011). Application of electrical image logging in the study of sedimentary characteristics of sandy conglomerates. Petroleum Exploration and Development, 38(4): 444-451. http://doi.org/10.1007/s12182-011-0118-0
[26] Khoshbakht, F., Memarian, H., Mohammadnia, M. (2009). Comparison of Asmari, Pabdeh and Gurpi formation's fractures, derived from image log. Journal of Petroleum Science and Engineering, 67(6): 65-74. http://doi.org/https://doi.org/10.1016/j.petrol.2009.02.011
[27] Khoshbakht, F., Azizzadeh, M., Memarian, H., Nourozi, G.H., Moallem, S.A. (2012). Comparison of electrical image log with core in a fractured carbonate reservoir. Journal of Petroleum Science and Engineering, 86-87(5): 289-286. https://doi.org/10.1016/j.petrol.2012.03.007
[28] Fan, X.Q., Wang, G.W., Dai, Q.Q., Li, Y.F., He, Z.B., Li, Q.B. (2019). Using image logs to identify fluid types in tight carbonate reservoirs via apparent formation water resistivity spectrum. Journal of Petroleum Science and Engineering, 178(7): 937-943. https://doi.org/10.1016/j.petrol.2019.04.006
[29] Zohreh, M., Junin, R., Jeffreys, P. (2014). Evaluate the borehole condition to reduce drilling risk an avoid potential well bore damages by using image logs. Journal of Petroleum Science and Engineering, 144(10): 318-330. http://dx.doi.org/10.1016/j.petrol.2014.07.027
[30] Nian, T., Jiang, Z.X., Wang, G.W., Chen, W.X., He, W.J., Fei, L.Y. (2018). Characterization of braided river-dlelta facies in the Tarim Basin Lower Cretaceous: Application of borehole image logs with comparative outcrops and cores. Marine and Petroleum Geology, 97(11): 1-23. https://doi.org/10.1016/j.marpetgeo.2018.06.024
[31] Fornero, S.A., Marins, G.M., Lobo, J.T., Freire, A.F.M., Lima, E.F.D. (2019). Characterization of subaerial volcanic facies using acoustic image logs: Lithofacies and log-facies of a lava-flow deposit in the Brazilian pre-salt, deepwater of Santos Basin. Marine and Petroleum Geology, 99(1): 156-174. https://doi.org/10.1016/j.marpetgeo.2018.09.029
[32] Massiot, C., McNamara, D.D., Lewis, B. (2015). Processing and analysis of high temperature geothermal acoustic borehole image logs in the Taupo Volcanic Zone, New Zealand. Geothermics, 3(1): 190-201. http://dx.doi.org/10.1016/j.geothermics.2014.05.010
[33] Cao, Y.C., Ma, B.B., Wang, Y.Z., Liu, H.M., Gao, Y.J., Liu, H.N., Chen, L. (2014). The particle texture characteristics of sandy conglomerate in the nearshore subaqueous fan of upper Es4 in the Yanjia Area, Dongying Depression. Natural Gas Geoscience, 25(6): 793-803. https://doi.org/10.11764/j.issn.1672-1926.2014.06.0793
[34] Yang, G. (2010). Analytical technique of gravels in core image and its application in research of conglomerate fan takingthe conglomerate fan, northern steep slope, Dongying Sag as an example. Petroleum Geology and Recovery Efficiency, 17(5): 20-23, 112. http://doi.org/10.13673/j.cnki.cn37-1359/te.2010.05.005