OPEN ACCESS
The aim of this study was to develop a desirable plan for the network of charging stations that suits the transition to electric vehicles. For this purpose, the number of two types of charging stations (i.e. supercharger station and destination charging station) was estimated. On this basis, the cost of network construction in Ireland was established. Then, the influencing factors of the shift to electric vehicles were analyzed against the population and other conditions of Ireland. The analysis shows that the charging stations should be built simultaneously in urban and rural areas, and the construction should precede the purchase of electric vehicles. The development timeline as divided into two phases before and after a ban on fuel cars. Next, the feasibility of the model to five other countries was discussed and improved to suit the features of Saudi Arabia. These countries were divided into three groups based on environmental stress, national wealth and land size, and were given different bases for selecting the development mode. The research findings lay theoretical basis for the promotion of electric vehicles and construction of charging stations in different countries
electric vehicles, network of charging stations, convenience
The reduction of gasoline use in cars is an economic and environmental imperative across the globe. In many countries, there are early signs of the boom in electric vehicles. Therefore, some countries, including China, have announced that they will ban gasoline and diesel cars in the coming years. The precondition for such a ban is to build enough charging stations at right places, allowing people to use their vehicles for daily commuting and occasional long-distance trips. The location and convenience of charging stations directly bear on the willingness of consumers to switch from fuel cars to electric vehicles.
Europe, the United States, and Japan started early in the research and construction of electric vehicle charging stations, but the development was slow due to the lack of a strong market leader and government support.
It is vital whether charging station could fit the need of the space-time demand from more and more popular new energy vehicles in the incremental promoting campaign successfully. The space-time demand characters of charging stations in Guangzhou central area was studied and a maximum covering model was proposed (Hu et al., 2018). using electric vehicles in urban areas as research objects, the location model of charging station construction cost, operating cost and user charging cost minimization is established (Bao et al., 2018). Studies of Fu Fengjie, Fang Yaxiu, Dong Hongzhao, and Chen Weifeng show that Optimized allocation of charging stations for electric vehicles based on historical trajectories, too (Fu et al., 2018).
Most of these researchers studied the optimal layout of charging stations from a specific city. The research on the overall network of charging stations in the national is little to promote the transformation of fuel cars into electric vehicles. So, we'll use it as a research goal (Tong et al., 2016).
As nations plan this transition, they need to consider the final network of charging stations (the number of stations, where they will be located, the number of chargers at the stations, and the differences in the needs of rural areas, suburban areas, and urban areas), as well as the growth and evolution of the network of charging stations over time. As nations seek to develop policies that promote the migration towards electric vehicles, they will need to design a plan that works best for their individual country (Huang et al., 2015).
In this paper, the charging station number estimation model respectively for two types of charging stations is presented. Secondly, the cost estimated model in Ireland is provided base on it. The popularization of the electric vehicle driving force model is established, according to the analysis of the Irish population distribution and national conditions, suggested that the charging stations in urban and rural should be built at the same time, and should be built the charger first, to promote people to buy electric cars. The full evolutionary timetable will be divided into prior and post a gas vehicle-ban. By analyzing the differences between the given countries, the original model is improved to suit the characteristics of Saudi Arabia. Finally, according to the characteristics of environmental stress, GDP per capita and the diameter of territory, the five countries are divided into three patterns, and give the decision basis for selecting the development mode.
2.1. Network of charging stations in the US (Object 1)
The status and development of the network of Tesla charging stations in the US were investigated to see if the network can realize the switch to electric vehicles in that country, to predict the number of charging stations needed if all US vehicles are propelled by electric motors, and to determine the distribution of charging station in urban, suburban and rural areas (Liu et al., 2014).
2.2. Network of charging stations in another country (Objects 2a, 2b and 2c)
The optimal number, position and distribution of charging stations were determined if another country (i.e. South Korea, Ireland and Uruguay) fully switches to electric vehicles. Then, the development of the charging station network in this country was planned for elevating the percentage of electric vehicles from 0% to 100%. The plan specifies whether the stations should be built in urban or rural areas, and whether station construction should precede or follow users’ purchase of electric vehicles. After that, the timeline for the transition to 100% electric vehicles was rolled out, with specific time points for 10%, 30%, 50% and 100%.
2.3. Feasibility of proposed plan for charging station network (Object 3)
The applicability of the proposed plan was verified through analysis on other countries that differ greatly from the said country in economy, geography and demographics, such as Australia, China, Indonesia, Saudi Arabia, and Singapore. The key influencing factors on plan selection were enumerated, and a classification system was established to create country-specific development model that promotes the transition to electric vehicles.
3.1. Hypotheses
The following hypotheses were put forward for this research:
1. The total number of vehicles remains stable, that is, any fuel car leaving the market is supplemented by an electric vehicle.
2. Every parking lot can be upgraded into a charging station, and all charging stations are built based on existing parking lots.
3. It takes four hours at the most to charge any electric vehicle.
4. The annual scrap rate of existing vehicles remains basically stable.
3.2. Modelling and solution
3.2.1. Modelling and solution for Object 1
(1) Estimation of the number of supercharger stations
Based on the highway distribution and the proportion of total highway mileage, the minimum number of supercharger stations in urban, suburban and rural areas can be obtained by the following formula:
${{\beta }_{i}}=\frac{S}{{{S}_{0}}}{{\gamma }_{i}}{{\mu }_{i}}$ (1)
where S is the total highway mileage; S0 is the battery mileage of supercharger (170 miles on flat roads; less than 170 miles on hilly roads); μi is the discount rate for the overlap of charging station services due to road density (μ3=1); γi is the proportion of urban, suburban and rural mileages in total highway mileage (Xiao et al., 2014).
San Francisco was selected as the typical city to acquire the exact γi of the urban, suburban and rural areas in the US. According to the road map of the city, the value of γ1: γ2: γ3 was determined as 10: 3: 1. On this basis, we have S=6,586,610km and S0=170miles (273.6km). Let μ1 and μ2 be 0.3 and 0.5, respectively, we have:
${{\beta }_{1}}=\frac{S}{{{S}_{0}}}{{\gamma }_{1}}{{\mu }_{1}}=24074.9\times \frac{10}{14}\times 0.3=5158$
${{\beta }_{2}}=2579$, ${{\beta }_{3}}=1719$
Hence, the total number of supercharger stations is $\beta = \sum _ { i = 1 } ^ { 3 } \beta _ { i } = 9456$.
(2) Estimation of the number of destinations charging stations
The US is a typical suburbanized country. Most Americans live in suburbs and work in cities. They must commute on every workday between home and office. It is assumed that the mileage of the electric vehicle is enough for urban residents to travel between home and office, and for rural residents to travel between home and farm. Besides, suppose that fast charge can satisfy their travel demand in case of emergency. In this case, the urban and rural residents’ demand for slow charging is negligible. Thus, this paper only considers the charging demand of suburban residents for commuting. To fulfill the commuting demand of suburban residents, the number of vehicles to be charged can be obtained as:
${{U}_{suburban}}=U{{A}_{1}}{{A}_{2}}{{A}_{3}}$ (2)
where U is the number of private vehicles; A1 is the probability of commuting by car; A2 is the probability of being a suburban car owner; A3 is the probability of vehicle charging (Zhang et al., 2014).
In the US, the working hours normally last 8 hours per workday. Suppose each electric vehicle can be fully charged at the destination charging station within 4 hours. Then, each charger can serve two vehicles in 8 hours. Thus, the minimum number of chargers can be expressed as $\lambda = \frac { U _ { \text {suburban } } } { 2 }$. If the number of chargers in each station falls in (Ma et al., 2013), the number of destination charging stations can be estimated as $\lambda _ { \text {station} } = \frac { \lambda } { \lambda _ { \text {charger} } } \left( \frac { \lambda } { 50 } \leq \lambda _ { \text {station} } \leq \frac { \lambda } { 10 } \right)$.
The commuting probabilities of Americans are listed in Table 1. Here, the mean probability A1=44.2% is adopted as the probability of commuting by car (Xiang et al., 2013).
Table 1. The commuting probabilities of Americans
|
|
New York |
Washington |
San Francisco |
Boston |
average |
|
public transport |
57% |
39% |
33% |
33% |
|
|
on foot |
15% |
14% |
11% |
15% |
|
|
by bike |
1% |
5% |
4% |
1.2% |
|
|
drive |
32% |
42% |
52% |
50.8% |
44.2% |
The car ownerships in urban, suburban and rural America are presented in Table 2. As a developed country, the US boasts an almost 100% car ownership. Hence, we have $A _ { 2 } = 51 \%$.
Table 2. The car ownerships in urban, suburban and rural America
|
distribution |
proportion of population |
|
city |
33% |
|
suburban |
51% |
|
rural |
16% |
The value of A3 was estimated by dividing the mean number of vehicles charging by the total number of electric vehicles in San Francisco (Zhao et al., 2011).
According to relevant statistics, $\mathrm { U } = 2.2 \times 10 ^ { 4 }$ and A3=5%. Hence, we have:
${{U}_{\text{suburban}}}=U{{A}_{1}}{{A}_{2}}{{A}_{3}}=2.2\times {{10}^{4}}\times 44.2%\times 51%\times 5%=247.962\times {{10}^{4}}$
Then, the minimum number of chargers is
$\lambda = \frac { U _ { \text {Suburban} } } { 2 } = \frac { 247.962 } { 2 } = 123.918 \times 10 ^ { 4 }$
The number of destinations charging stations is:
$\frac { 1239180 } { 50 } \leq \lambda _ { \text {station} } \leq \frac { 1239180 } { 10 } ,$ i.e., $24783 \leq \lambda _ { \text {station} } \leq 123918$
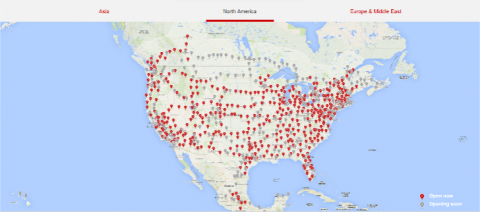
Figure 1. Location of destination charging stations
Figure 2. Location of supercharger stations
As shown in the figures above, there are currently 3,015 destination charging stations and 533 supercharger stations in the US. In our estimation, the destination charging stations and supercharger stations account for over 10% and 5.8%, respectively, of the estimated number of charging stations, and the number of stations under construction equals that of existing stations. This means Tesla charging stations will be able to fulfill the charging demand once all American vehicles became electric.
3.2.2. Modelling and solution for Objects 2a, 2b and 2c
(1) Modelling of Object 2a
This subsection estimates the number, location and distribution of charging stations in Ireland. The cost of charging stations can be expressed as:
$C={{\lambda }_{destination charger}}{{m}_{1}}+\beta {{\lambda }_{supercharger}}{{m}_{2}}$ (3)
where m1 and m2 are the unit price of the destination charging station and the supercharger station, respectively. The unit prices of these stations are listed in Table 3.
Table 3. Cost of single charging station
|
type |
Cost |
|
supercharger |
Us $175000 |
|
destination charger |
Us $100000 |
The plan for charging stations is affected by the influencing factors of infrastructure construction:
$T=\frac{M}{Cd}$ (4)
where is the minimum number of years for infrastructure construction; Mis the lowest cost of infrastructure construction; Cis the national expenditure on transport infrastructure; is the proportion of the national expenditure on transport infrastructure invested to construct charging stations.
(2) Modelling of Object 2b
Despite the advanced economy, the Irelanders are not very interested in electric vehicles because of the lack of environmental stress. Better infrastructure is needed to facilitate the shift to electric vehicles. Therefore, the charging stations should be built before the consumers buy electric vehicles. The desire to buy these vehicles hinges on the internal factors of environment pressure and infrastructure improvement, and the external factors of a ban on fuel cars and incentive policies for electric vehicles.
The factors promoting the purchase of electric vehicles can be modelled as:
$\eta ={{\eta }_{1}}+{{\eta }_{2}}+{{\eta }_{3}}+{{\eta }_{4}}$ (5)
where $\eta _ { 1 }$ is environmental stress; $\eta _ {2}$ is infrastructure improvement (convenience); $\eta _ { 3 }$ is the incentive policies for electric vehicles; $\eta _ { 4 }$ is the ban on fuel cars.
Hence, the key influencing factors on the plan for charging station construction include environmental stress and financial policies. The stronger the environmental stress, the more convenient the infrastructure and the more the government can spend to shorten the construction cycle of infrastructure.
(3) Modelling of Object 2c
The ban on fuel cars is the prerequisite to the full adoption of electric vehicles. Thus, our overall development plan for charging stations consists of two phases: the phase from infrastructure construction to total ban on fuel cars and the phase after all fuel cars exit the market.
Before the issuance of the ban, the infrastructure construction of Ireland was at an all-time low, and the cost of infrastructure construction was at the minimum level. The minimum number of years needed to complete the infrastructure construction $\mathrm { T } = \frac { M } { c d }$. It is assumed that 15% of Irish expenditure on transport infrastructure is invested annually to construct charging stations at year T=1.18.
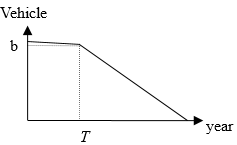
Suppose the infrastructure was far from enough before the ban. In this case, the growth in electric vehicles is negligible due to the inconvenience in travelling. Since a fuel car usually works for 15 years, all fuel cars must be scrapped within 15 years to complete the transition to electric vehicles. After the ban is enacted, the number of fuel cars will decrease and the market share will be occupied by electric vehicles. The processes of fuel cars leaving the market and electric vehicles entering the market are illustrated in Figure 3 and Figure 4, respectively.
Figure 3. The process of fuel cars leaving the market
Figure 4. The process of electric vehicles entering the market
It is assumed that the number of fuel cars will remain unchanged before the ban is released and gradually exit the market after the ban is enacted. This process can be expressed as y=kx+b.
Let O be the number of fuel cars per 1,000 people in Ireland, and P (unit: 103) be the Irish population. According to Figure 3, we have $b = \frac { O P } { 10000 }$. When the fuel cars are completely scrapped, we have $k = - \frac { b } { 15 } .$ Hence, $y = - \frac { O P } { 15000 } x + \frac { O P } { 1000 }$.
Let Ni be the percentage of electric vehicles. Then, the timeline for the electric vehicles to replace fuel cars can be expressed as:
$x=\frac{\frac{OP}{1000}-(1-{{N}_{i}}\frac{OP}{1000}}{-\frac{OP}{1500}}=15{{N}_{i}}$ (6)
Table 4. Timeline for the transition to electric vehicles
|
The percentage of electric vehicles in total vehicles. |
Time required (year) |
|
10% of electric cars |
1.5 |
|
30% of electric cars |
4.5 |
|
50% of electric cars |
7.5 |
|
90% of electric cars |
13.5 |
|
100% of electric cars |
15 |
The implementation of this timeline is influenced by the following factors:
(1) The age distribution of existing vehicles: This timeline was calculated based on the uniform distribution of vehicle ages. An error will emerge if this is not the case.
(2) Population density: the population density is positively correlated with the total number of vehicles, the total cost of infrastructure and the delay of the ban on fuel cars.
(3) Per capita GDP: the ban on fuel cars is released earlier in rich countries.
3.2.3. Modelling and solution for Object 3
The influencing factors of the network development can be summed up as:
$\eta ={{\eta }_{1}}+{{\eta }_{2}}+{{\eta }_{3}}+{{\eta }_{4}}$
Specifically, $\eta _ { 1 }$ is mainly affected by urban population density $\left( \eta _ { 1 } \propto \mathrm { t } \right)$. If t is on the rise, $\eta _ { 3 }$ is mainly affected by the per capita GDP $\xi \left( \eta _ { 3 } \propto \xi \right)$.
Sampling was carried out to estimate the urban population density. Taking China for example, the mean population density of some Chinese cities is 7,639.9 people/km2 (Table 5). The mean urban population densities of other countries are recorded in Table 6.
Table 5. Mean population density of some Chinese cities (people/km2)
|
city |
density of population |
city |
density of population |
|
Shanghai |
24137 |
Beijing |
17232 |
|
Wuhan |
6924 |
Quanzhou |
33315 |
|
Guangzhou |
2880 |
Xi’an |
7870 |
|
Shenzhen |
5255 |
Foshan |
3024 |
|
Tianjin |
2314 |
Shantou |
2724 |
|
East Guan |
3335 |
Chengdu |
11260 |
|
Hefei |
3998 |
Changsha |
3190 |
|
Wenzhou |
2558 |
Chongqing |
3145 |
|
Nanjing |
5915 |
Shenyang |
22392 |
|
Harbin |
3164 |
Hangzhou |
4889 |
|
Suzhou |
2426 |
Xuzhou |
770 |
|
Zhengzhou |
4097 |
HongKong |
6544 |
Table 6. Mean urban population densities in other countries (people/km2)
|
nationality |
Average urban population density |
|
Australia |
795.8 |
|
China |
7639.9 |
|
Indonesia |
4359.2 |
|
Saudi Arabia |
2406.5 |
|
Singapore |
7579 |
For China, the mean urban population density is 7,639.9 people/km2, a signal of huge environmental stress. However, the Chinese economy is not powerful enough to support the immediate construction of the proposed network of charging stations. Instead, China should develop its network of charging stations in a gradual manner. In other words, the parameter d remains constant. Hence, the model for Ireland is applicable to China.
For Australia, the mean urban population density is merely 795.8 people/km2. This country is an equivalent to Ireland in terms of the development of charging stations, thanks to its sparse population, good environment, no environmental stress and advanced economy.
For Singapore, the mean urban population density is 7,579 people/km2. As a small country, Singapore is not suitable for construction of too many charging stations. Considering the GDP ($297 billion), there is virtually no time to establish a perfect network of charging network.
For Indonesia, the mean urban population density is 4,359.2 people/km2. The environmental pressure is not big, but its per capita GDP is only $3,570.29. Thus, there is not many money available for the construction of charging stations. This means the development model of Ireland can apply to this country.
For Saudi Arabia, the mean urban population density is 2,406.5 people/km2. Although the population is not dense, this country suffers from huge environmental stress due to the severe pollution of the oil industry. Combined with the strong national power, Saudi Arabia should adopt a faster development plan for charging stations. The d in the Irish model should be replaced with d(t). As shown in Figure 5, the investment should increase first and then decline. Thus, the Ireland model does not apply to Saudi Arabia.
The Saudi situation suggests that environmental stress cannot be simply measured by population density. A better way to characterize environmental stress is:
${{\eta }_{1}}={{\alpha }_{1}}t+{{\alpha }_{2}}\theta $ (7)
where $\theta$ is the degree of industrialization, i.e. the proportion of total industrial output in GDP; $\alpha _ { i }$ is the proportionality coefficient.
Figure 5. The trend of d(t) for Saudi Arabia
To sum up, the infrastructure construction is impacted by the country size, the environmental stress and the national wealth. Under these factors, the construction of charging station network has the following features:
First, the construction speed is uniform and the construction cycle is $\mathrm { T } = \frac { M } { c d }$.
Second, the construction speed first increases and then decreases, and the construction period can be obtained from T:
$M=C\int_{0}^{T}{d\left( t \right)dt}$ (8)
Third, if a country is too small, charging at home is enough to satisfy the general demand. This eliminates the need for destination charging stations, or any kind of charging stations. The construction cycle is approximately zero.
Through the above analysis, three development modes of charging station construction were identified for different countries (Table 7). Before choosing a development mode, the planner should check if the country satisfies mode 3. If not, the development mode should be selected according to the environmental pressure and national wealth. Mode 2 is optimal if the country is a developed one subjected to huge environmental stress; Mode 1 is ideal if the country is a developing one under huge environmental stress, or the country, regardless of its wealth, suffers from a small environmental stress.
Table 7. Three modes of development
|
nation |
environmental pressure |
Land diameter |
developed level |
pattern |
|
China |
high |
>150 km |
developing country |
mode 1 |
|
Australia |
little |
>150 km |
developed country |
mode 1 |
|
Indonesia |
high |
>150 km |
underdeveloped countries |
mode 1 |
|
Saudi Arabia |
high |
>150 km |
developing country |
mode 2 |
|
Singapore |
high |
44km<150km |
developed country |
mode 3 |
To sum up, the key influencing factors on development mode include mean population density, degree of industrialization, land area and national wealth.
To create a desirable plan for charging station network that suits the transition to electric vehicles, this paper estimates the number of two types of charging stations (i.e. supercharger station and destination charging station). On this basis, the cost of network construction in Ireland was established. Then, the influencing factors of the shift to electric vehicles were analyzed against the population and other conditions of Ireland. The analysis shows that the charging stations should be built simultaneously in urban and rural areas, and the construction should precede the purchase of electric vehicles. The development timeline as divided into two phases before and after a ban on fuel cars. Next, the feasibility of the model to five other countries was discussed and improved to suit the features of Saudi Arabia. These countries were divided into three groups based on environmental stress, national wealth and land size, and were given different bases for selecting the development mode. The research findings lay theoretical basis for the promotion of electric vehicles and construction of charging stations in different countries.
This paper is made possible thanks to the generous supports from the Educational Reform Research Program of the Thirteenth Five-Year Plan of Education Science in Shaanxi Province, 2016 (Grant No.: SGH16H153).
Bao Y., Zuo Z. Y., Yin W., Niu S., Zou D. L. (2018). Study on selection planning of electric vehicle charging station. Journal of Changchun Normal University, Vol. 37, No. 8, pp. 46-50.
Fu F. J., Fang Y. X., Dong H. Z., Chen W. F. (2018). Optimized allocation of charging stations for electric vehicles based on historical trajectories. Automation of Electric Power Systems, Vol. 42, No. 12, pp. 72-80. http://doi.org/10.7500/AEPS20171026002
Hu P. T., Cao X. S., Qin H. X., Rong F. J. (2018). The study about charging station locating of the new energy vehicle a based floating car data: Take the Guangzhou central area as an example. Modern Urban Research, No. 8, pp. 28-36.
Huang Y., Guo C. X., Wang L. C. (2015). The electric vehicle sub-group scheduling srategy considering user satisfaction. Power System Automation, Vol. 39, No. 17, pp. 183-191. http://doi.org/10.7500/AEPS20150331011
Liu Y. Q., Wang J. Y., Kokko A. (2014). Policy and business model innovation in demonstration operation of electric vehicles: Global experience and Chinese practice. Chinese Soft Science, No.12, pp. 1-16.
Ma L. L., Yang J., Fu C., Liu P., Sun Y. Z. (2013). Review on the impact of electric vehicle charging and discharging on power grid. Power System Protection and Control, Vol. 41, No. 3, pp. 140-148.
Tong J. J., Wen J. Q., Wang D. (2016). Multi-objective optimization charging strategy for electric vehicles based on time-sharing price. Power System Protection and Control, Vol. 44, No. 1, pp. 17-23.
Xiang D., Song Y. H., Hu Z. C., Xu Z. W. (2013). Research on the optimal peak valley price of electric vehicles in V2G. Journal of Chinese Electrical Engineering, Vol. 33, No. 31, pp. 15-25, 2.
Xiao X. N., Wen J. F., Shun T. (2014). Research and suggestions on several key issues in the planning of electric vehicle charging infrastructure. Journal of Electrical Technology, Vol. 29, No. 8, pp. 1-10.
Zhang Y., Pu Y. J., Shi L. F. (2014). Construction of electric vehicle charging infrastructure and government strategy analysis. China Soft Science, No. 6, pp. 167-181.
Zhao J. H., Wen F. S., Yang A. M., Xin J. B. (2011). Influence of electric vehicle on power system and its scheduling and control problems. Power System Automation, Vol. 35, No. 14, pp. 2-10, 29.