OPEN ACCESS
Inadequate supply of water is increasingly found throughout the world, especially in areas where rapidly growing population is placing greater request on limited aquifer resources. This paper applies 2-D electrical resistivity imaging to investigate groundwater potential using four survey lines with Pole-dipole (PDP) array at 0.75m minimum electrode spacing of 9m by 30m. The 2-D resistivity data was process using Res2Dinv and Surfer 8 software, the output set apart layers indicated relatively lower and higher resistivity which was used to locate groundwater potential area and depth and the result was correlated with a borehole in the study area, to validate the result, one survey line was correlated with the existing on-site borehole (BH10) to identify groundwater potential and depth. The validated values were applied to the remaining survey lines without borehole records to map subsurface of the study area. The ERI results unveiled that the area were delineated by two main zones, saturated zone consists of clay, sandy clay; clay with resistivity values 0.1Ωm to 10Ωm with N-value 20, sandy clay with resistivity values 7Ωm to 100Ωm with N-value 32 at depth 7m, and shale zone with resistivity values 20Ωm to 500Ωm with N-value 70 which are hard material at depth 10.5m. In conclusion the aquifer unit in the study area have a significant groundwater potential to the depth 10.5m to allow reservoir within the aquifer.
aquifer, groundwater potential, saturated zone, shale
Fresh water exists not only on the surface of the earth as streams or lakes, but also subsurface as underground water, and the water in them is called groundwater ; groundwater is simply the subsurface water that fully saturates pores or cracks in soils and rocks (USGS, 2017; Garvelmann and Weiler, 2012). Table 1 shows the resistivity values of some of the typical rocks and soil materials and the resistivity values of some type of water as shown in table 2. Wells can be drilled into the aquifers and water can be pumped out. Precipitation eventually adds water (recharge) into the porous rock of the aquifer. The pace of recharge is not the same for all aquifers, though, and that must be considered when pumping water from a well. Pumping too much water too fast draws down the water in the aquifer and eventually causes a well to yield less and less water and even run dry. In fact, pumping well too much can even lead another neighbor's well to run dry if both are pumping from the same source (aquifer). Sometimes the porous rock layers become tilted in the earth. A link does not certainly exist between the water-bearing capacity of rocks and the depth at which they are found. Much dense granite that will yield little or no water to a well may be exposed at the land surface (USGS, 2017; Adeeko and Muhammad, 2015; Abidin et al., 2017). Since there is a rapidly growing population which placed greater demand on limited aquifer resources in the study area, the aim of the survey was to investigate groundwater potential of Kedah area using 2-D electrical resistivity imaging, results indicate that borehole drilling in the study area is achievable but to a depth of 10.5 meters to allow reservoir within the aquifers.
Table 1. Resistivity values of common rocks and soil materials in survey area (Keller and Frischknecht, 1996)
|
Material |
Resistivity (Ωm) |
|
Alluvium |
10 to 800 |
|
Sand |
60 to1000 |
|
Clay |
1 to 100 |
|
Groundwater (fresh) |
10 to 100 |
|
Sandstone |
8 - 4 x 10⁴ |
|
Shale |
20 - 2 x 10³ |
|
Limestone |
50 x 103 |
|
Granite |
5x 10³ to 106 |
Table 2. Resistivity values of some type of water (Keller and Frischknecht, 1996)
|
Type of Water |
Resistivity (Ωm) |
|
Precipitation |
30 to 1000 |
|
Surface water (Igneous rock) |
30 to500 |
|
Surface water (Sedimentary rock) |
10 to 100 |
|
Groundwater (Igneous rock) |
30 to 150 |
|
Groundwater (Sedimentary rock) |
>1 |
|
Seawater |
≈0.2 |
|
Drinking water (max salt content 0.25%) |
>1.8 |
|
Water of irrigation and stock watering (max salt content (0.25%) |
>0.65 |
1.1. Basic concept of electrical resistivity methods
The principle that surface electrical resistivity survey is based on the circulation of electrical potential in the ground around a current-carrying electrode relies upon the electrical resistivities and circulation of the surrounding soils and rocks (EPA, 2016; Sirhan and Hamidi, 2016). In the field, the usual procedure is to apply an electrical direct current (DC) between two electrodes inserted in the ground and to measure the difference of potential between two additional electrodes that do not transport current. Generally, the potential electrodes are in line between the current electrodes, but in basis, they can be situated anywhere. The current used is either direct current, changed direct current (i.e., a square-wave alternating current), or AC of low frequency typically about 20 Hz (Hajizadeh and Akhondi, 2016; Zimmermann et al., 1966; Horton and Hawkins, 1965). All analysis and interpretation are done based on direct currents. The circulation of potential can be connected theoretically to ground resistivity’s and their circulation for some simple cases, notably, the case of a horizontally stratified ground and the case of homogeneous masses divided by vertical planes e.g., a vertical fault with a large throw or a vertical dike; for other kinds of resistivity circulations, interpretation is commonly done by qualitative comparison of observed reaction with that of idealized hypothetical models or on the basis of empirical methods (McConville et al., 2001; Stewart and McDonnell, 1991; Rosli et al., 2014; Asano et al., 2002). Mineral grains comprised of soils and rocks are fundamentally nonconductive, except in some exotic materials such as metallic ores, so the resistivity of soils and rocks is controlled generally by the volume of pore water, its resistivity, and the package of the pores; to the range that differences of lithology are followed by differences of resistivity, resistivity surveys can be useful in finding bodies of anomalous materials or in evaluating the depths of bedrock surfaces (Abidin et al., 2014; Azhar et al., 2016; Habibah et al., 2004). The groundwater surface is usually marked by an abrupt change in water saturation and thus by a change of resistivity in coarse, granular soils, however, there may be no such resistivity change coinciding with a piezometric surface in fine-grained soils; there are wide ranges in resistivity for any particular soil or rock type, and resistivity values cannot be directly interpreted in terms of soil type or lithology, since the resistivity of a soil or rock is controlled primarily by the pore water conditions. Therefore, zones of distinctive resistivity can be indicated with specific soil or rock units based on local field or drill-hole information, and resistivity surveys can be used profitably to expand field investigations into areas with very limited or nonexistent data. Also, resistivity surveys may be used as an inspection method, to detect anomalies that can be further examined by complementary geophysical methods or drill hole (Ghafar et al., 2016; Tan et al., 2017).
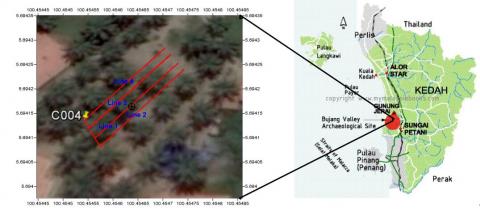
Kedah is situated in the northwest coast of the Peninsular Malaysia, bordered by the Straits of Malacca on the west, by Penang and Perak in the south, and by Perlis in the north. Kedah covers an area of 9,425sq.km, and its highest peak is Gunung Jerai, standing at 1200meters. The climate of Kedah is tropical monsoon, with a uniform temperature between 21°C to 32°C throughout the year and it is generally dry and warm from January to April (dry season), and wet from May to December (rain season), the humidity is consistently high in the lowlands, averaging 82-86 percent per annum and the average annual rainfall falls between 2,032mm to 2540mm (Andika et al., 2017).
2.1. Study area
Archaeological evidence suggests that Kedah is the oldest civilization site of Peninsular Malaysia. The study was done in Archaeological site, Sungai Batu, Lembah Bujang, Kedah, Malaysia, the area is surrounded by palm trees in all sides and has nearly flat topography, there are four (4) lines for electrical resistivity tomography survey as shows in figure 1. The lines were spaced every 0m ≤ x ≤ 9m, 0m ≤ y ≤ 30m with a trace interval of 0.75m for electrode spacing and 3m per line with 41 electrodes for each line using pole-dipole (PDP) array, between latitude 5.69400N – 5.694265N and longitude 100.454582E – 100.4547866E.
Figure 1. Map of kedah and study area
2.2. Field data acquisition for electrical resistivity imaging (ERI)
The arrival of 2-D and 3-D resistivity imaging has opened whole new application areas to electrical methods. Before early 1990s, the electrical resistivity method was mainly used in resistivity sounding, profiling, and mapping surveys (Sirhan and Hamidi, 2016; Mohamed et al., 2009). Quantitative interpretation was mainly confined to 1-D (one-dimensional) structure of the subsurface consisting of horizontal layers (Mohamed et al., 2009). The multielectrode systems made it practical to carry out 2-D imaging surveys that give a more accurate picture of the subsurface (Saad et al., 2012) in a routine manner. Unlike the conventional 4 electrodes system, a multielectrode system has about 41 electrodes connected to the ABEM SAS 4000 Terrameter via a multi-core cable. A switching circuitry controlled by an internal microcomputer ABEM Selector which related to ABEM SAS 4000 Terrameter, automatically selects the appropriate 4 electrodes for each measurement. Measurement was made on the grid survey of 9m x 30m plot with minimum electrode spacing of 0.75m and lines were spaced 3m apart for all the lines. Electrical Resistivity Imaging (ERI) is an advanced geophysics method used to determine the subsurface resistivity distribution by making measurements on the ground surface. ERI data are rapidly collected with an automated multi-electrode resistivity meter. ERI profiles consist of a modeled cross-sectional (2-D) plot of resistivity (Ωm) versus depth. ERI interpretations, supported by borehole data or alternate geophysical data, accurately represent the geometry and lithology and/or hydrology and/or petrology of subsurface geologic formations. Electrical Resistivity Imaging measures resistivity. Resistivity, measured in Ωm, is the mathematical inverse of conductivity. It is bulk physical property of materials that describes how difficult it is to pass an electrical current through the material. Resistivity measurements can be made with either an alternating current (AC) or a direct current (DC). As resistivity measurements are frequency dependant, care must be taken when comparing resistivity values collected using different techniques.
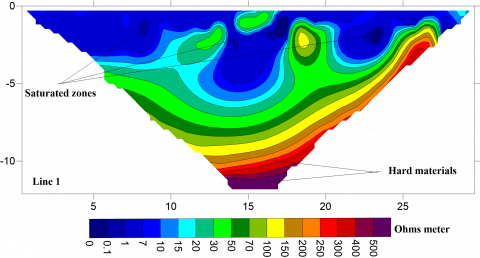
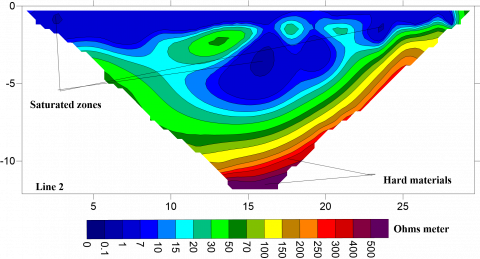
The 2-D resistivity inversion model of line 1-4 were shown in fig 2-5, generally, the resistivity value of the study area ranges from 1Ωm-500Ωm with total depth of 10.5m, the ERI results shown that the study area consists of two main zones, clay with resistivity value of 0.1Ωm-100Ωm, and shale materials with resistivity value of 20Ωm-500Ωm with the depth 10.5m and the saturated zone with resistivity value of <100Ωm with the depth 5m and hard layer with resistivity value of 100Ωm-500Ωm which indicated fractured zone.
Figure 2. 2-D resistivity inversion model for line 1
Figure 3. 2-D resistivity inversion model for line 2
Figure 4. 2-D resistivity inversion model for line 3
Figure 5. 2-D resistivity inversion model for line 4
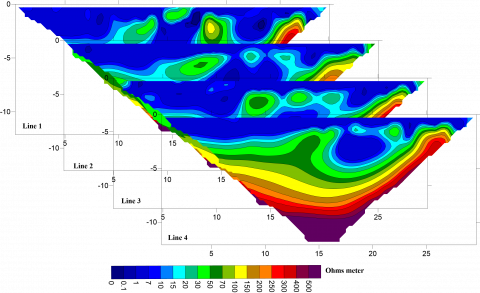
Figure 6. 2-D resistivity inversion model for all survey lines
The combination of all the survey lines were arranged according to increased elevation starting from line 1 at the top until line 4 at the bottom; therefore, the vast saturated zones arrangement was situated at shallow of the survey as shown in fig 6. Baharuddin et al., (2017); Nordiana et al., (2017) in their report investigate a shallow alluvial landscape was investigated using 2-D resistivity with EHR technique to determine the thickness of alluvium at the Lembah Bujang, Kedah (Malaysia) which show the saturated zone are the aquifer, the aquifer in this study area is therefore defined by the saturated zone which agrees with their earlier studies. Generally, the study area was an alluvium with resistivity value of 0.1Ωm-500Ωm. The first layer was divided into two groups, sandy clay is top layer with resistivity value 20Ωm - 100Ωm and clay is the bottom layer with resistivity value 0.1Ωm -20Ωm. The resistivity characteristic shows that the study area was saturated with depth < 5m, the ERI result was related with a borehole (BH10) in survey line one to identify the distinguishing subsurface and the BH10 shows overburden was alluvium (sand gravel) and depth to penetration of 14.30m which exhibit moderate yield of groundwater and that the aquifer was shallow in the study area. Interrelationship between the geotechnical data and geophysical result revealed that the area consists of two main zones. The first zone composed of sandy clay, clay; the clay has resistivity value 0.1Ωm to 10Ωm at depth of 5m with N-value 7-20, sand clay has resistivity value 7Ωm to 100Ωm at depth of 7m with N-value of 9-32 which indicated saturated zone. The second zone composed of mottle dry, content little weathered and gravel deposit with resistivity value 20Ωm to 500Ωm at depth of 10.5m have N-value of 32-70 which indicate shale materials; the spiral auger penetration is very slow as shown in table 3.
Table 3. Soil classifications of resistivity and N-value
|
Geotechnical Records |
Geophysical Records |
|
BH10 record shows two layers; the first layer consists of two-part (i) sandy clay at the top and (ii) clay at the bottom with N-value 7-20 |
Indicate saturated zone which is slip into two groups, (i) sandy clay is at the top layer with resistivity value 20Ωm -100Ωm and (ii) clay is at the bottom layer with resistivity value 1Ωm -20Ωm |
|
Second layer consists of mottle, gravel (shale material) with N-value 20-70 |
Indicate little weathered in shale material with resistivity value >100Ωm |
A soil’s electrical resistivity value mostly varies inversely proportional to the water content and dissolved ion concentration as clayey soil display high dissolved ion concentration, wet clayey soils have lowest resistivity of all soil material while coarse, dry sand and gravel deposits and massive bedded and hard bedrock have the highest ERV as reported by Azhar et al., 2016; Ghafar et al., 2016; Nordiana et al., 2013. The interactions between 2D resistivity and borehole record in the study area shows that the area consists of dark brownish sandy clay, reddish or yellowish clay and shale material which are very firm dry condition. The collection of all the survey lines, line 01 at the top and line 04 at the last were put in an order according to the increased elevation; and the considerable saturated zones arrangement were situated at top of all the lines shown in figure 6.
In summary, the sand gravel aquifer in this area tend to be thin and discontinuous, borehole completion in this area can meet the needs of most domestic users; boreholes producing from shallow aquifers are moderately to highly susceptible to contamination and there are no registered significant groundwater withdrawal facilities utilizing in this borehole BH10. As reported by Azhar et al., 2016 the electrical resistivity value is largely control by the changes of sedimentary earth materials beneath the ground surface the result gather from their study area exists of two zones, which are residual soil zone with a resistivity of 10Ωm - 600Ωm and shale zone with a resistivity of 20Ωm - 2000Ωm. According to geology result and stratigraphic information coming from existing borehole in line one of the surveys, we suggested that the resistive layer in the study area is interpreted as unconsolidated and saturated. However, the ERI have provided useful information about alluvium within the study area which has moderate yield of groundwater potential.
The investigation of groundwater potential was delineated using ERI correlated with a borehole data, resistivity values was associated by three soil types, resistivity values <100Ωm shows the first layer loose and dry alluvium; resistivity values between 0.1Ωm - 10Ωm implied as second layer which was saturated alluvium and layer with resistivity values >100Ωm indicated as third layer which were shale were obtained within the study areas. Alluvium is potential groundwater within the area which shows moderate potential for groundwater production and the aquifer is shallow in the study area. There is a good correlation between the geophysical method (ERI) and geotechnical (borehole record). It is proficient to use several interconnected geophysical methods in an exploration program instead of depending on a single exploration method.
Authors acknowledge Universiti Sains Malaysia (USM) for providing fund under the major research project titled “Geophysical Application and Approaches in Engineering and Environmental Problems” with grant no. 1001/PFIZIK/811323, and School of Physics, Geophysics section for providing the equipment used for this research and Staff of geophysics laboratory, also postgraduate students’ geophysics team that have helped in data acquisition. Centre for Global Archeological Research Malaysia USM for allows us to carry out the survey in their site God bless you all.
Abidin M. H. Z., Saad R., Wijeyesekera D. C., Ahmad F., Baharuddin M. F. T., Tajudin S. A., Madun A. (2017). The influences of basic physical properties of clayey silt and silty sand on its laboratory electrical resistivity value in loose and dense conditions. Sains Malaysian, Vol. 46, No. 10, pp. 1959-1969. https://doi.org/10.17576/jsm-2017-4610-35
Abidin M. H. Z., Ahmad F., Wijeyesekera D. C., Saad R. (2014). The influence of basic physical properties of soil on its electrical resistivity value under loose and dense condition. Journal of Physics: Conference Series, Vol. 495, pp. 1-13. https://doi.org/10.1088/1742-6596/495/1/012014
Adeeko T. O., Muhammad H. (2015). A geophysical survey involving twelve vertical electrical sounding (VES), lokoja areas council kogi state. International Journal of Scientific Research in Environmental Sciences, Vol. 3, No. 7, pp. 0256-0265.
Andika F., Saad R., Saidin M. M., Muztaza N. M., Amsir (2017). Identification of sungai batu sediment using 2-D resistivity imaging and seismic refraction methods for ancient river mapping at Kedah, Malaysia. Journal of Physics: Conference Series, Vol. 995 (2017) 012088, pp. 1-7. https://doi.org/10.1088/1742-6596/995/1/012088
Asano Y., Uchida T., Ohte N. (2002). Residence times and flow paths of water in steep unchaneled catchments, Tanakami, Japan. Journal of Hydrology, Vol. 261, pp. 173–192. https://doi.org/10.1016/S0022-1694(02)00005-7
Azhar A. T. S., Hazreek Z. A. M., Aziman M., Haimi D. S., Hafiz Z. M. (2016). Acidic barren slope profiling using electrical resistivity imaging (ERI) at ayer hitam area Johor, Malaysia. Journal of Physics: Conf. Series, Vol. 710, No. 012008 pp. 1-9. https://doi.org/10.1088/1742-6596/710/1/012008
Baharuddin M. F. T., Hazreek Z. A. M., Azman M. A. A., Madun A. (2018). Prediction of groundwater level at slope areas using electrical resistivity method. Journal of Physics: Conference Series, Vol. 995, No. 012084, pp. 1-8. https://doi.org/10.1088/1742-6596/995/1/012084
Environmental Protection Agency (EPA) (2016). Download 05/07/2017, https://archive.epa.gov/esd/archive-geophysics/web/html/resistivity_methods.html Last updated 5/19/2016
Garvelmann C. K., Weiler M. (2012). A porewater-based stable isotope approach for the investigation of subsurface hydrological processes. Hydrology and Earth System Sciences, Vol. 16, pp. 631–640.
Ghafar S. H. M. A., Sukri S. M., Muztaza M. N. (2016), Determination of slope failute by using 2-D resistivity method. Jurnal Teknologi (Science and Engineering), Vol. 78, No. 1, pp. 1-5.
Hajizadeh F., Akhondi S. R. (2016). Determining aquifers and bedrock of Qaen plain by the resistance measurement method. Modern Applied Science, Vol. 10, No. 1, pp. 200-206.
Habibah J., Wan Fuad W. H., Mohamad M. T. (2004). Pengaruh jenis batuan sekitar terhadap taburan Pb dalam sedimen muara sungai merbok. Kedah, Geological Society of Malaysia Bulletin, Vol. 48, pp. 7-11.
Horton J. H., Hawkins R. H. (1965). Flow path of rain from the soil surface to the water table. Soil Science, Vol. 100, pp. 377–383. https://doi.org/10.1097/00010694-196512000-00001
Keller G. V., Frischknecht F. C. (1996). Electrical methods in geophysical prospecting. Pergamon Press Inc. Oxford
McConville C., Kalin R. M., Johnston H., McNeil G. W. (2001). Evaluation of recharge in a small temperate catchment using natural and applied oxygen- 18 profiles in the unsaturated zone. Ground Water, Vol. 39, pp. 616–623. https://doi.org/10.1111/j.1745-6584.2001.tb02349.x
Mohamed A. F., Yaacob W. Y. W., Taha M. R., Samsudin A. R. (2009). Groundwater and soil vulnerability in the Langat Basin Malaysia. European Journal of Scientific Research, Vol. 27, pp. 628-635.
Nordiana M. M., Bery A. A., Taqiuddin Z. M., Jinmin M., Abir I. A. (2017). 2-D electrical resistivity tomography (ERT) assessment of ground failure in urban area. Journal of Physics: Conference Series, Vol. 995, No. 012076, pp. 1-8. https://doi.org/10.1088/1742-6596/995/1/012076
Nordiana M. M., Saad R., Mokhtar S., Shyeh S. K, Kiu Y. C., Ismail N. A., El-Hidayah N. I. (2013). Mapping alluvial landscape using 2-D resistivity with EHR technique at Lembah Bujang, Kedah (Malaysia). Electronic Journal of Geotechnical Engineering, Vol. 18.
Rosli S., Nordiana M. M., Mokhtar S. (2014). Resistivity studies of archaeological anomaly at Sungai Batu, Lembah Bujang, Kedah (Malaysia). Electronic Journal of Geotechnical Engineering, Vol. 19.
Saad R., Muztaza N. M., Edy T. M. (2012). Groundwater detection in alluvium using 2D electrical resistivity tomography (ERT) 2D electrical resistivity tomography. Electronic Journal of Geotechnical Engineering, Vol. 17.
Sirhan A., Hamidi M. (2016). Detection of soil and groundwater domestic pollution by the electrical resistivity method in the West Bank, Palestine. Near Surface Geophysics, Vol. 11, No. 4, pp. 371- 380.
Stewart M. K., McDonnell J. J. (1991). Modeling base flow soil water residence times from deuterium concentrations. Water Resources Research, Vol. 27, pp. 2681–2693. https://doi.org/10.1029/91WR01569
Tan S. N. M. A., Dan M. F. M., Tonnizam M. E., Saad R., Madun A., Hazreek Z. A. M. (2017). Interpretation of 2D resistivity with engineering characterisation of subsurface exploration in Nusajaya Johor, Malaysia. Journal of Physics: Conference Series, Vol. 995, No. 012078, pp. 1-6. https://doi.org/10.1088/1742-6596/995/1/012078
U. S. Geological Survey (USGS) (2017). Geophysical methods in exploration and mineral environmental investigations. http://water.usgu.gov/edu. Last updated 28/03/2017; download 18/04/2017
Zimmermann U., Munnich K. O., Roether W., Kreuzt W., Schubach K., Siegel O. (1966). Tracers determine movement of soil moisture and evaporation. Sciences Journal, Vol. 152, pp. 346-347. https://doi.org/10.1126/science.152.3720.346