Aziz Ullah Khan
© 2020 IIETA. This article is published by IIETA and is licensed under the CC BY 4.0 license (http://creativecommons.org/licenses/by/4.0/).
OPEN ACCESS
This paper demonstrated the design of a Metal Oxide Surge Arrester for a 132 kV system with a rated voltage of 120 kV according to specifications. The study model was chosen to be Pinceti model which is a derivation of the IEEE standard model of Lightning arrester design. The design specifications for the lab tests on 120kV rated arrester for ZnO material were obtained from the catalogue of Ohio Brass Pvt. Ltd. The parameters for the lumped components were derived from the manufacturer’s data sheet while the non-linear characteristic was derived from curve fitting based on the Pinceti provided curves in literature, using Matlab Curve Fitting Tool. The design was simulated on EMTP-RV commercial software and the results before optimization as well as after optimization are presented. A cross comparison with the manufacturers data results in 1.113% relative error, which is in competition with similar designs for different rated and system voltages in literature. The study presents an improved model of a metal oxide arrester for 132kV system, with its lumped and exponential parameters presented in detail.
metal oxide surge arrester, lightning surge arrester, simulation, MOV, residual voltage, over-voltage, CFOV, EMPT-RV
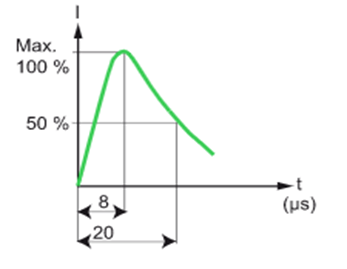
Power system outages are affected by many direct and indirect factors, of which lightning is the most important one. Lightning causes disruption in the power distribution system that directly or indirectly affect the end consumer. Lightning occurs because of friction between oppositely charged clouds. Lightning strikes usually target conductive material as well as electrically charged regions of the earth such as Power Transmission Systems, antennas, and other conductive surfaces [1]. It is a natural phenomenon in which millions of volts and thousands of amperes of current strike the stratosphere or ground where conductive or electrical equipment are present. This phenomenon produces a breakage in the insulating layers of air between the clouds and the earth; so a visible flash of light is seen [2]. The waveform of a strike for 8/20us is shown below:
Figure 1. Standard waveform of a lightning strike
During decades of observation on lightning strikes and lab experiments with Tesla coils and artificially produced lightning inside labs, concluded the above waveform, which roughly stands for the type of waveform possible in nature.
Figure 1 shows the main categorization of lightning strike which reaches its peak value in 8 microseconds and then drops to half its peak value in 20 microseconds [3].
Underground transmission system is completely insulated below the layers of soil, while the overhead transmission system is exposed to air as well as lightning strikes. In third world countries, overhead distribution systems are a common practice. For a lightning strike to damage a distribution system, it does not need to touch the transmission system physically. All it has to do is to strike at the vicinity of the transmission system. This type of a lightning strike at the vicinity of a distribution system typically induces about 300 thousand volts of electricity in the nearby electrical transmission lines. There is no way of safeguarding the distribution system or the nearby transmission lines from such a high voltage. Typical protective techniques such as compensators are not enough to safeguard the nearby transmission lines from the effects of the induced voltage of this order [4].
In a normal overhead transmission system, insulator strings are attached as a safety measure that can absorb voltage swells up to specific limits. This limit is called Critical Flashover Voltage (CFOV) rating. CFOV is defined as, “a maximum value of the absorption power of the insulator string in a voltage swell phenomena in the distribution system”. In the event of exceeding this rating, the transmission system could be damaged by the voltage swell, resulting in damage to very expensive equipment in the nearby substation. The phenomenon of exceeding voltages over the ratings of the critical flashover voltage of the insulator string is called a flashover. Researches are carried out everywhere in the world to test this threshold limit of an insulating string, or another insulating equipment, by creating an artificial flashover.
Table 1. Arrester models
|
IEEE Model |
|
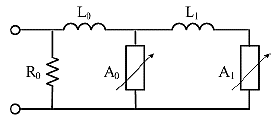
$\begin{aligned} \mathrm{L} 1 &=15 \mathrm{d} / \mathrm{n}[\mu \mathrm{H}] \\ \mathrm{R} 1 &=65 \mathrm{d} / \mathrm{n}[\Omega] \\ \mathrm{L} 0 &=0.2 \mathrm{d} / \mathrm{n}[\mu \mathrm{H}] \\ \mathrm{R} 0 &=100 \mathrm{d} / \mathrm{n}\lceil\Omega] \\ C &=\frac{100 n}{d}[p F] \end{aligned}$ d is the estimated height of the arrester in meter n is the number of parallel columns of MO in the arrester |
|
Pinceti Model |
|
$\begin{aligned} L_{1} &=\frac{1}{4}\left(\frac{\frac{U_{r 1}}{T_{2}}-U_{\frac{r 8}{T_{2}}}}{U_{\frac{r 8}{T_{2}}}}\right) U_{r}[\mu H] \\ L_{0} &=\frac{1}{12}\left(\frac{\frac{U_{r 1}}{T_{2}}-U_{\frac{r 8}{T_{2}}}}{U_{\frac{r 8}{T_{2}}}}\right) U_{r}[\mu H] \end{aligned}$ Ur is the rate voltage $U_{r 1 / T 2}$ is the residual voltage at 10 kA fast front current surge $1 / T 2 \mu s$ $U_{\frac{r 8}{20}}$ is the residual voltage at current surge with $8 / 20 \mu s$ shape $R_{0}=1 M \Omega$ |
|
Fernandez-Diaz model |
|
$\begin{align} & \text{L1}=\frac{2}{5}\frac{{{U}_{\frac{r8}{T2}}}-Uss}{{{U}_{\frac{r8}{T2}}}}{{U}_{r[\mu H]}} \\ & \text{C}=\frac{1}{55}\frac{{{U}_{\frac{r8}{T2}}}-Uss}{{{U}_{\frac{r8}{T2}}}}{{U}_{r[pF]}} \\\end{align}$ Ur is the rated voltage Ur8/20 is the residual voltage at 10kA current surge with $8 / 20 \mu s$ shape in kV Uss is the residual voltage at at $500 \mu s$ or $30 / 70 \mu s$ in $k V$ $R_{0}=1 M \Omega$ |
In the past few decades, transmission line arresters (TLAs) have shown promising results for protection of distribution systems at substation as well as transmission line level [3, 5, 6]. Transmission line arrester are specifically designed electrical circuits that can absorb electrical power above a certain rating up to a certain limit. Most of the absorbed power is diverted to the nearby ground level; and is discarded from the distribution system safely, while the remaining is dissipated as heat. Table 1 describe surge arrester models.
Overvoltage occurs from various effects both naturally, as well as from system faults in the electrical power system. They are classified into two classes, switching over-voltage and lightning over-voltage. For designing of extra high-voltage parameters of a power system distribution, it is necessary that switching over-voltages are taken into account. For instance, designing of an arrester for an extremely high-voltage line requires the 1/2 μs front-of-wave (FOW) switching Surge analysis [7]. Specific interest is the lightning strike that occurs in the vicinity or directly on a substation, or a part of a power distribution system. Lightning strikes are typically in the range of millions of volts, with thousands of amperes of current. A direct hit on a transmission system causes drastic damage to the equipment if the system is unprotected. However, it is not necessary that the lightning strike should hit the transmission system directly, a nearby hit can also cause the collapse of insulating airfield, and can cause induced voltages and induced current in the transmission system. The induced voltages can reach as high as 300 kilovolts with currents as large as 10000 amperes [3].
In the research [8], authors proposed an Ultra High Voltage TLA, which was tested on a 828kV overhead transmission line system. The design was tested in parallel combination with the existing fixed arrester. The tests were carried out in collaboration with energy Supplier Company, and the arrester proved its working for the said purpose. However, TL protection parameters were not calculated in the research paper. A study in Malaysia was conducted recently on the design and selection of a sure arrester for a 500kV overhead transmission line system. It was concluded that a 132kV arrester with suitable modifications can be utilized to work for the 500kV line, and that in order to protect the line, the surge arrester must be installed [9].
This paper is an intimate understanding of the working of a transmission line arrester installed on an overhead transmission line system for protection of the nearby substation as well as the transmission system.
The designing of the metal oxide surge arrestor without a spark gap is a difficult task due to its dynamic behavior. Many researchers have followed a modern evolutionary algorithm approach for finding a best possible set of values of the arrestor for a given rated voltage. However, as proposed by IEEE, the trial and error method of deriving the parameters of the design is a simple approach before fine-tuning them to perfection. Therefore, the methodology is:
i. Derivation of the nonlinear resistor values for a Pinceti Model by curve fitting using Matlab for the raw model of the arrestor.
ii. Feeding these design values to the EMTP-RV for dynamic adjustments, utilizing the ZnO Fitter Routine (a form of automatic dynamic adjustment function) [10].
iii. Testing, evaluating, and cross validating the results of each fitting results with commercial expected waveforms, before tuning again.
iv. If error is less than 11% for sufficiently enough experiments, stop the routine and plot results, otherwise go back to first step.
v. Cross-compare with latest journals in 132 kV overhead transmission lines system Metal Oxide arrestor design errors.
The methodology is also shown in Figure 2 as a flow chart for better realization:
Figure 2. Flow chart of the research method
3.1 Simulation results
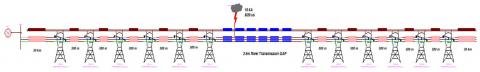
The simulation scenario chosen in this study has been the focus of many researchers throughout the last decade and the researches that have followed the same model are cited as Refs. [11-15]. The usual analysis requirement demands the elimination of every possible transient effect from the transmission line especially the tower containing the arrester. This is necessary for correct justification of the analysis and results of the arrester model. Figure 3 shows a simulation environment of twelve Towers with 2 kilometers river crossing and 30 kilometers to the source generator. 30 kilometers distance from the generator is taken in order to avoid travelling waves effects on the arrester. Each consecutive Tower is placed at 300 meters from the previous one. 12 consecutive towers are placed so that the effect of the reduction of lightning surges can be observed if required.
Figure 3. The simulation scenario for this study
3.2 Lightning model simulation
The model of the Lightning surge has been designed on the model proposed by, time series of the Lightning Voltage Surge as well as the current surge is shown in Figure 4 and 5 consecutively:
Figure 4. Max value of the lightning source
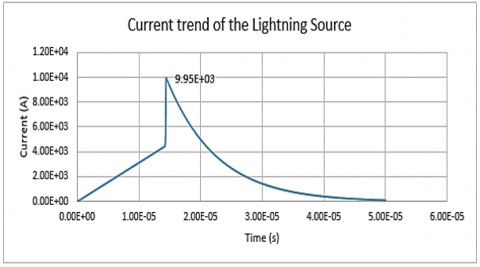
Figure 5. Lightning current waveform (8/20 μs) showing peak value of ~10kA
The maximum value of the lightning strike is about 1M Volts on an 8/20 μs waveform.
The current waveform shows the following series:
3.3 Curve fitting results in Matlab
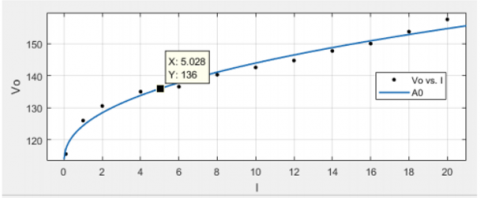
Matlab curve fitting toolbox is used for curve fitting on the values obtained from the IEEE group for A0 and A1 that gives equations from which any dependent value for an independent input could be found out. The graphs shown in Figure 6 and 7, both for A0 and A1 are generated with general model power2 with 95% confidence bounds.
Figure 6. Curve fitting result for A0
The curve fitting routine run for A0 gives a binomial power fit with the following equations:
General model Power2:
f(x)= a*x^b+c (1)
Coefficients (with 95% confidence bounds):
a = 11.62 (4.257,18.98)
b = 0.428 (0.2639,0.5922)
c =112.8 (105.2,120.4)
SSE: 28.9
R-square: 0.982
Adjusted R-square: 0.978
RMSE: 1.792
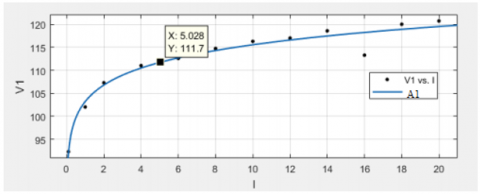
Figure 7. Curve fitting result for A1
Similarly, for A1:
General model Power2:
f(x)= a*x^b+c (2)
Coefficients (with 95% confidence bounds):
a = 114.8 (-403.7,633.3)
b = 0.04436 (-0.1503,0.2391)
c = -11.61 (-528.7,505.5)
Goodness of fit:
SSE: 31.24
R-square: 0.9582
Adjusted R-square: 0.9489
RMSE: 1.863
3.4 Residual voltages
The time series of residual voltage data is shown in Figure 8:
Figure 8. Residual voltage in arrester with peak value shown
The residual voltage test shows a peak value of 194kV which is lower than the maximum residual voltage obtained from manufacturer specification that is 291kV, and satisfies the model requirements.
3.5 Footing currents
Footing current is the term used for the current flowing in the low impedance resister at the base of the tower. It is used for providing a high conductive path to the current appearing on the arrester in the event of a lightning Strike. Typical values of this resistor lie between 20 to 25 ohms.
Figure 9 shows a discharge current maximum value of 4.79kA which passes from the footing resistor and drops to 0 Amperes at about 25µs, which shows the stability for arrester.
Figure 9. Footing current of the arrester showing peak value
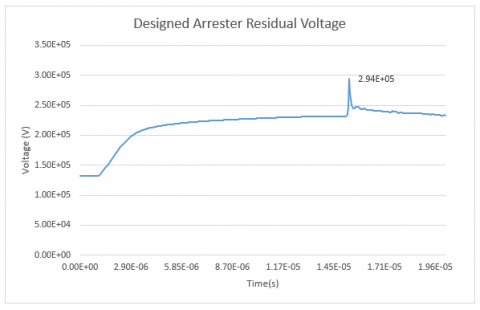
3.6 Simulation results after parameter adjustment
For a 20 μs duration of simulation, after the adjusted parameters of the L1 from default value to 2.905 in multiple runs of the simulation, the resulting waveform shows promising results given below:
Figure 10. Residual voltage on the designed arrester
The Figure 10 above shows a peak value of 294.239 kV of residual voltage which is upto the standards and the consistency is assured as well.
3.7 Design parameters summary
The arrester design parameters are tabulated in Table 2:
Table 2. Designed parameters of the arrester
|
Parameter |
Value |
Original Value |
|
L0 |
1.0648 |
1.0648 |
|
L1 |
2.905 |
3.1958 |
|
Rfoot |
23Ω |
20 Ω |
3.8 Analysis
The analysis of the designed arrester is done visually from the graphs considering the various requirements of the manufacturer as well as the design criteria. However, a few of the analysis is done mathematically to prove the arrester’s efficacy in the desired voltage rating installation. For this study, the following parameters are analyzed mathematically for the justification of the design.
3.8.1 Lightning impulse withstand voltage – LIWV
The lightning impulse withstand voltage is defined using the following equation:
LIWV = BIL /VrPeak
LIWV $_{\frac{8}{20}}=550 \mathrm{kV} / 322 \mathrm{kV}=1.708$ (3)
322kV is the peak residual voltage from the manufacturer specification table provided in Table 3. The higher this value, the better the insulation level. So, LIWV value is satisfactory.
3.8.2 Energy absorption capability
The instantaneous energy absorption at 0.5 μs is thus calculated as:
Energy $=\mathrm{Pd}$
Energy $=\mathrm{Vid}$
Energy $=294239 \times 5000 \times 0.5 \times 10^{-6}$
735.59 Jouls@10kA $\in 0.5 \mu \mathrm{s}$
This value of energy is also in agreement and is in fact improved from previous designs.
The total energy absorbed in 20 μs of the lightning strike is calculated as below:
Total Energy$=\int_{1009}^{9950} \mathrm{VI} \Delta t d x\\=\int_{1009}^{9950}|-7786.95 x+294239| d x \Delta t\\=378869094867.025 \Delta \mathrm{t}\\=378869094867.025 \times 20\\\times 10^{-6}JoulesTotalEnergy$
Total Energy $=7.577$ MegaJoules (4)
This value is greater than the required minimum of 5kJ that justifies the energy absorption capability of the designed arrester.
3.8.3 Relative error
Referring to the manufacturer’s data sheet reproduced in Table 3:
Table 3. Ohio brass EP series 120kV arrester for 132kV system
|
Rated Voltage |
Continuous Voltage |
1/2us @10kA Res Voltage |
8/20us @10kA Res Voltage |
|
120 kV |
98kV |
322kV |
291kV |
The relative error is defined as:
$\epsilon=\frac{\left(V_{S}-V_{d}\right)}{V_{d}} \times 100 \%$ (5)
In this study:
$\epsilon=\frac{294.239 k V-291 k V}{291 k V} \times 100 \%$
$\epsilon=1.113 \%$
This value is targeted to result between 0 and 4%, and the resulting value is quiet expectedly good and relates to the manufacturer’s specs, hence the designed arrester is improved in its relative error, LIWV, as well as its energy absorption capability.
This paper demonstrated the design of a Metal Oxide Surge Arrester for a 132 kV system with a rated voltage of 120 kV according to specifications. The study model was chosen to be Pinceti model which is a derivation of the IEEE standard model of Lightning arrester design. The design specifications for the lab tests on 120kV rated arrester for ZnO material were obtained from the catalogue of Ohio Brass Pvt. Ltd. The parameters for the lumped components were derived from the manufacturer’s data sheet while the non-linear characteristic was derived from curve fitting based on the Pinceti provided curves in literature, using Matlab Curve Fitting Tool.
The design was simulated on EMTP-RV commercial software and the results before optimization as well as after optimization are presented here. Comparison with recent publications has not been done because similar study could not be found in the recent years. However, a cross comparison with the manufacturers data results in 1.113% error, which is in competition with similar designs for different rated and system voltages in literature. The total energy absorption capability of the arrester is 7.577 MegaJoules, and is above the required minimum value of 5 MJ. Hence the design is satisfied.
The author of this study presents an improved model of a metal oxide arrester for 132kV system, with its lumped and exponential parameters presented in detail. The improved design works in agreement with the manufacturer’s desired configuration, for which the lumped parameters are found out. The process is elaborated and explained in detail.
|
BIL |
basic insulation level |
|
C |
capacitance, F |
|
CFOV |
Critical flashover voltage |
|
d |
estimated height of the arrester, m |
|
EMTP |
electromagnetic transient program |
|
FOW |
front-of-wave |
|
I |
current, A |
|
$L_{0}, L_{1}$ |
inductance, H |
|
LIWV |
lightning impulse withstand voltage |
|
MO |
metal oxide |
|
n |
number of parallel columns of MO in the arrester |
|
p |
power, w |
|
$R_{0}, R_{1}$ |
resistance, Ω |
|
RMSE |
root mean square error |
|
SSE |
sum of squares error |
|
t |
time, sec |
|
TLAs |
transmission line arresters |
|
$U_{r}$ |
rated voltage, V |
|
$U_{\frac{r 1}{T 2}}$ |
residual voltage at 10 kA fast front current surge, V |
|
$U_{\frac{r 8}{20}}$ |
residual voltage at 10 kA current surge with 8/20 μs shape, V |
|
V |
voltage, V |
|
$V_{\text {rPeak}}$ |
peak residual voltage, V |
|
ZnO |
zinc oxide |
[1] Ritenour, A.E., Morton, M.J., McManus, J.G., Barillo, D.J., Cancio, L.C. (2008). Lightning injury: A review. Burns, 34(5): 585-594. https://doi.org/10.1016/j.burns.2007.11.006
[2] Uman, M.A. (1994). Natural lightning. IEEE Transactions on Industry Applications, 30(3): 785-790. https://doi.org/10.1109/28.293729
[3] Abdel-Salam, M., Ahmed, N.A., Elhamd, I.S. (2005). Varistor as a surge protection device for electronic equipments. 2 2004 IEEE International Conference on Industrial Technology, 2004. IEEE ICIT '04., Hammamet, Tunisia, pp. 688-694. https://doi.org/10.1109/ICIT.2004.1490158
[4] Rakov, V.A., Rachidi, F. (2009). Overview of recent progress in lightning research and lightning protection. IEEE Transactions on Electromagnetic Compatibility, 51(3): 428-442. https://doi.org/10.1109/TEMC.2009.2019267
[5] Surtees, A.J. (2011). A review of IEC 62305-4 protection against lightning Part 4: Electrical and electronic systems within structures. 2011 7th Asia-Pacific International Conference on Lightning, Chengdu, pp. 478-481. https://doi.org/10.1109/APL.2011.6110170
[6] Flauzino, R.A., Moraes, L.A., Araújo, M.A., Altafim, R.A.C., Batista, O.E. (2015). Practical methodology for modeling and simulation of a lightning protection system using metal-oxide surge arresters for distribution lines. Electric Power Systems Research, 118: 47-54. https://doi.org/10.1016/j.epsr.2014.07.017
[7] Ali, S.A. (2013). Design of lightning arresters for electrical power systems protection. Advances in Electrical and Electronic Engineering, 11(6): 433-442. https://doi.org/10.15598/aeee.v11i6.661
[8] Latiff, N.A.A., Illias, H.A., Bakar, A.H.A., Dabbak, S.Z.A. (2018). Measurement and modelling of leakage current behaviour in ZnO surge arresters under various applied voltage amplitudes and pollution conditions. Energies, 11(4): 875. https://doi.org/10.3390/en11040875
[9] Islam, M.Z., Rashed, M.R., Yusuf, M.S.U. (2018). ATP-EMTP modeling and performance test of different type lightning arrester on 132kv overhead transmission tower. 3rd International Conference on Electrical Information and Communication Technology, 7-9: 1-6. https://doi.org/10.1109/EICT.2017.8275172
[10] Li, H.J., Birlasekaran, S., Choi, S.S. (2002). A parameter identification technique for metal-oxide surge arrester models. IEEE Transactions on Power Delivery, 17(3): 736-741. https://doi.org/10.1109/TPWRD.2002.1022797
[11] Hassan, N.H.N., Abu Bakar, A.H., Illias, H.A., Abd Halim, S., Mokhlis, H., Terzija, V. (2019). Analysis of discharge energy on surge arsrester configurations in 132kV double circuit transmission lines. Measurement: Journal of the International Measurement Confederation, 139: 103-111. https://doi.org/10.1016/j.measurement.2019.02.088
[12] Martinez-Velasco, J.A., Castro-Aranda, F. (2005). Modeling of Overhead Transmission Lines for Lightning Studies. International Conference on Power Systems Transients IPST’05 in Montreal Canada, 18(1): 1-6.
[13] Derafshi Beigvand, S., Moradi, M. (2013). Comparison between different installation locations of surge arresters at transmission line using EMTP-RV. 28th International Power System Conference (PSC 2013), pp. 1-6.
[14] Martinez-velasco, J.A., Castro-aranda, F. (2018). Assessment of the Lightning Flashover Rate of a Shielded Transmission Line Protected by Surge Arresters. Presented at the International Conference on Power Systems Transients (IPST’07) in Lyon.
[15] Corellas, G. (2016). Transient overvoltages in gas insulated systems. UNIVERSITÀ DEGLI STUDI DI PADOVA Dipartimento di Ingegneria Industriale. http://tesi.cab.unipd.it/53422/1/Corellas_Giulia_tesi.pdf.