Charlie Urame* | Paul Ratnamahilan Hoole
© 2020 IIETA. This article is published by IIETA and is licensed under the CC BY 4.0 license (http://creativecommons.org/licenses/by/4.0/).
OPEN ACCESS
Hydro-Electricity and Solar Power are environmentally friendly renewable sources of energy that utilize the potential energy from dammed water and the sun respectively to generate electricity. In this paper is reported a new design and implementation of combining solar and hydro-electric power. The turbine and gearbox system used in this design is fabricated from scarp parts of used appliances. The hydro head of the Pico-Hydro plant commissioned was 5m which accumulated a hydraulic potency of the stream of about 5.886kW. The prime mover of the generator consisted of a modified crossflow turbine that is coupled with a gearbox to amplify the rpm of the system. A 500W synchronous generator was driven by the prime mover to generate raw phase shifted AC power. This raw power was rectified with a 25 A full wave rectifier and used in conjunction with 12 V 400 AH deep cycle battery bank system to supply power to a newly furnished double storey house. The generator output through the full wave rectifier is connected to a load controller for optimal charge efficiency. The load controller is connected to the battery bank through a Programmable Logic Controller (PLC). The PLC activates a dummy resistive hot water element when the battery bank is fully charged. The Arduino GSM module monitors the entire process and automatically sends notification via a SIM interface to the system administrator notifying the system administrator of the on/off state of the heating element.
cross-flow turbine, Pico-Hydro plant, programmable logic controller
1.1 Motivation
As Papua New Guinea (PNG) moves into the 21st Century after being colonised by settlers one century ago the demand for energy has dramatically increased. Electricity is no exception. Papua New Guinea has one of the lowest electricity access rates in the region with only 13% of households having access to reliable electricity [1]. With 87% of the population living in extremely remote areas that will feasibly be never connected by the PNG national electricity board PPL’s existing grid the need to for small off-grid Pico, Micro and Mini-Hydro plants and micro-grids is tremendous.
The World Bank estimates that at least 25% of PNG’s will never be connected to the main national electricity grid. The country’s only authorized electricity service provider PNG Power Ltd will not serve these populations as their mandate only extends 10 kilometres from PPL’s existing grid. Serving this population is much more cost effective through off-grid or stand-alone micro-grids approaches and currently there is minimal investment and no national agency for off-grid electrification [1]. The government is not taking any progressive steps in addressing rural electrification for remote communities nor is it promoting investors and NGOs to invest in rural electrification.
PNG has over the last few decades experienced a decline in productivity in communities due to the unavailability of electricity. In the highlands of Papua New Guinea, for instance, the most productive hours in a day are to a maximum of 10 hours (0700-1700 hours). Main sources of fuel are wood and kerosene. A typical villager has an income potential of K5 (about USD 1) per day. Kerosene is K2/L, this is a dear commodity to a villager. During wet seasons dry firewood is difficult to source. School children are unable to study at night due to the unavailability of lights. Villagers who have access to electronic gadgets like mobile phones, radios, TVs other basic electronic equipment either have to purchase a generator to be able to use the equipment. Otherwise they have to tediously source for sources of electricity to pay the service provider to charge their equipment. As the world is becoming more digitized and centralised the need for electricity is not only in the technically advanced world but also for the rural communities of Papua New Guinea increases on a day to day basis. How can the University trained and educated Papua New Guineans help the rural bulk of population? How can we provide electricity to them in the simplest most reliable and economic way to help improve the sustainability of their livelihood? The motivation of this research, design and implementation project is to initiate a capstone project that is implementable, cost effective, sustainable and simple to operate. Most of the Electrical and Mechanical Equipment used in this project have been fabricated from scrap parts, i.e. old washing machine parts, used motors and used cables. The capstone project is implemented in Massy in Goroka Urban LLG of Eastern Highlands Province in Papua New Guinea. The reported herein is an original work, based on reported approaches to Pico-hydroelectric generation [2-8], seeking to keep the cost to a minimum so that it becomes feasible for remote, poor villages. A review of the current state of renewable resources, solar and wind in particular, is available [9-11]. Such a study on micro- and pico- hydroelectric power generation in PNG is still to be done. The photovoltaic- Pico hydroelectric generation was designed, fabricated, installed and successfully tested.
1.2 Feasibility
Goroka Urban LLG alone has an annual rainfall of 1840 mm with steep mountainous terrain making it ideal for the setup of Micro and Mini Hydro plants where there are streams and rivers to supply electricity to individuals and communities. Fillings Creek in Massy Village located 5 km North of Goroka Township runs on steep mountainous terrain. The high velocity Filings Creek has a flow rate of 150 l/s making it ideal for a micro-hydro power plant set-up. This paper covers the entire design scope of the pico-Hydro project that was commissioned.
Hydra Consultancies Ltd as a fully owned national company is specialized in the commissioning of micro and mini Hydro plants and strives to ensure electricity is readily available to rural off-grid communities.
1.3 Environmental impacts of hydro power
Compared to large hydropower projects, micro hydropower (MHP) schemes have relatively low negative environmental and socio-economic impacts. As recent evaluation studies on MHP projects and the along going electricity supply suggest, particularly socio-economic impacts of the plants are to be considered positive. Just like other off-grid renewable energy applications, MHP schemes have a variety of direct and indirect positive impacts, which are often interrelated.
In environmental terms, the MHP project raises the awareness of proper watershed management and reforestation to secure the sustainable use of water resources. Moreover the plants contribute to protect the environment and combat climate change through reduced use of kerosene/gasoline and small batteries. Generally it should be noted that impacts not only depend on the MHP itself, but also on what training and campaigns go along with its implementation and in what way the communities tap the full potential of the electricity supply.
2.1 Pico/Micro-hydro system
Hydro-Power is Electricity produced by Generators that are driven by turbines powered by water pressure as shown in Figure 1. The stored water in the forebay/water reservoir has Potential energy. Potential energy converted into Kinetic energy when the stored water is channeled through the penstock pipe that connects to a turbine at the end of the penstock outlet. That kinetic energy contained in the water is used to propel the turbine at the end of the penstock pipe nozzle converting the kinetic energy into mechanical energy. The turbine is attached via a shaft to the generator’s rotor that is housed in the stator coil that comprises of permanent magnets (poles). The turbine excited rotor rotates in the stator assembly producing electricity. In summary the mechanical energy in the shaft of the generator is converted into electrical energy by the generator. This useful electrical energy (in the form of AC or DC) is used by electrical equipment that are connected as load. The efficiency of the overall system, given the pipe friction loses and turbine deficiencies, is generally on the range of 50% of theoretical power associated with the energy of the flowing water. Micro-hydro has been in use for many years in many applications.
The turbine varies from site to site according to the given pressure head and design flow at each site.
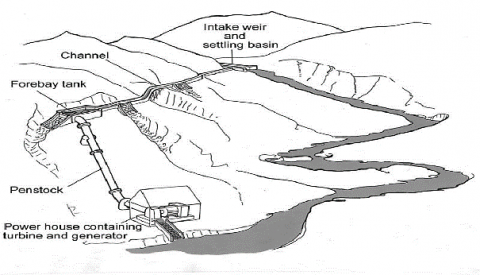
Figure 2 shows a typical Run-of-the-River (ROR) Hydro system. Water flow in upstream will be diverted in intake weir and it will flow into the channel. The channel transports the water to forebay tank before going to penstock pipe. In the tank, debris will be filtered and prevented from being drawn to the turbine by means of penstock. Power conversion is done inside the power house, and turbine will transfer mechanic energy to the electric generator, then generator produces electric energy. This ROR Hydro design will be employed by the proposed pico-hydro plant [2].
Figure 1. Block diagram of ROR Pico/Mini hydro plant
Figure 2. Overview schematic of Pico/Mini hydro power plant [4]
Table 1. Different countries and their hydro power classification
|
Country |
micro |
mini |
small |
|
(kW) |
(kW) |
(MW) |
|
|
United States |
<100 |
100-1000 |
1-30 |
|
China |
- |
<500 |
0.5-25 |
|
USSR |
<100 |
- |
0.1-30 |
|
France |
5-5000 |
- |
- |
|
India |
<100 |
101-1000 |
1-15 |
|
Brazil |
<100 |
100-1000 |
1-30 |
|
Norway |
<100 |
100-1000 |
1-10 |
|
Nepal* |
<100 |
100-1000 |
1-10 |
|
Various |
<100 |
<1000 |
<10 |
The classification of hydro-power plants according to size/capacity versus different countries can be taken as [6]; In Table 1 is shown the use of micro, mini ad small hydroelectric power generators used in different countries.
2.2 Forebay (reservoir)
The forebay of the hydro plant is located at a higher altitude than the powerhouse to make up the desired water pressure necessary to propel the turbine. The greater the height difference between the forebay and the powerhouse the more potential energy the water possesses. The outflow velocity of the forebay is calculated using
$V=\surd{2 G H(\text {kinetic energy and potential energy})}$
where,
V = velocity (m/s)
G = acceleration due to gravity (9.81 m/s)
H = hydro head (m)
The size of the forebay is capable of holding 400 L of water. An altimeter used to calculate the height difference between the penstock inlet and penstock outlet (forebay and powerhouse) is found to have a height difference of 5 m (5 m head). Substituting that into the equation we find the outflow velocity to be:
$V=\sqrt{(2} \times 9.81 \mathrm{~ms}^{-2} \times 5 \mathrm{~m})$ (1)
$V=9.9045 m s^{-1}$ (2)
2.3 Penstock design
The penstock design as shown in Figure 3 comprised of 40 m x 100 mm diameter pressure PVC pipes. PVC was selected over HDVP pipes due to water efficiency in terms of minimal friction losses and good flow rate capacity (calculate/reference friction losses).
Figure 3. 100mm PVC penstock pipe with forebay inset
2.4 Turbine selection
Turbines of Hydroelectric plants harness the kinetic energy from the falling/jetted water and convert the kinetic energy into mechanical energy that propels the rotor of the generator. There are various types of water turbines such as Kaplan Wheel turbine, Francis Wheel turbine, Pelton wheels, Turgo wheel turbine and Propeller Turbine. The type of turbine to be used in the design of hydro-turbine power plants is dependent on the water height, water quantity and the total power generation capacity expected to be generated [6]. The turbine of choice employed by our design scope is a fabricated crossflow turbine. Crossflow turbines use medium head and medium flow rate for optimal operation. The design of this Crossflow turbine however employs the principle of utilizing the flow rate of water more instead of its head due to limited hydro head. A gearbox will be used to increase the rpm output of the turbine for an overall better power efficiency of the generator.
2.5 Crossflow turbine design
The impulse turbine used in our design scope is a modified crossflow turbine constructed from two 0.5 m diameter stainless steel washing machine basin. In Figure 4 is shown the cross section of the Crossflow turbine and in Figure 5 is shown the fabricated Crossflow turbine.
i. Number of blades: The selection of optimum number of blades is very important in the design of Turbine Runner, fewer numbers of blades would result in underutilization of water available to the turbine and excessive number of blades may cause the pulsating power and reducing the turbine efficiency [6]. Comparing the high flow rate (150 l/s) to the cross-section area of the turbine the most suitable number of blades was estimated at x8 stainless steel blades reinforced and screwed to the turbine hub.
ii. Blade spacing: Proper blade spacing allows the water to strike, on the blades for maximum thrust production, the blade spacing depends upon the number of blades used in the turbine runner [6].
Blade Spacing $=\frac{360^{\circ}}{\text { number of blades }}$ (3)
Blade Spacing $=\frac{360^{\circ}}{8}$ (4)
Blade Spacing $=45^{\circ}$ (5)
iii. Runner diameter: Diameter of runner is selected depending upon the flow conditions. If there is larger flow through the turbine select a large diameter of turbine and for the low water flow conditions select a smaller diameter of turbine [6].
Figure 4. Cross-section schematic of crossflow turbine
Figure 5. Fabricated mechanical crossflow turbine
2.6 Hydro potency
2.6.1 Flowrate and head measurement
Head is the perpendicular height difference between the generator house where the turbine is located and the forebay/water reservoir where the water is initially drawn. Flow rate is the amount of water that flows past a given point in a set period of time and is measured in litres per second (litre/second) or l/s.
Flow rate can be measured by:
Using the Bucket method the flow rate of the penstock outlet was calculated to be 150 l/s.
Head is measured using:
Using an altimeter the head was determined to be 5 m.
2.6.2 Hydro power
The Turbine Power potency of the Hydro power plant is calculated as:
$P=p g H Q n$ (6)
where,
P = Power generated by the turbine shaft (kW)
Q = Water flowrate (m3/s1)
H = Head (m)
g = Acceleration due to Gravity (9.81 ms-2)
p = Water Density (1000 kgm-3)
ƞ= Turbine Efficiency (normally 60-80%) [6]
Substituting the calculated flow rate (150l/s) and head (5m) into the equation the power potential generated by the turbine is estimated to be;
$P=1000 \mathrm{kgm}^{-3} \times 9.81 \mathrm{~ms}^{-2} \times 5 \mathrm{~m} \times 0.15 \mathrm{~m}^{3} \mathrm{~s}^{-1}$$\times \frac{80 \%}{100 \%}$ (7)
$P=5,886 W$ (8)
$P=5.886 kW$ (9)
2.7 Generator
The Generator operates on the principle of electromagnetic induction and produces power when the neodymium rotor when spun by the prime mover (Crossflow turbine) cuts the existing flux lines on the stator windings, inducing an electromagnetic flux. The generator that is driven by the Crossflow turbine is a 24V 500W 3-Phase Synchronous 8-Pole Permanent Magnet Wind Generator, shown in Figure 6, that has been reworked and modified to fit the hydro-electric design of the pico-hydro plant.
Figure 6. Modified 24V 500W 3-Phase synchronous generator
2.8 Rectifier bridge
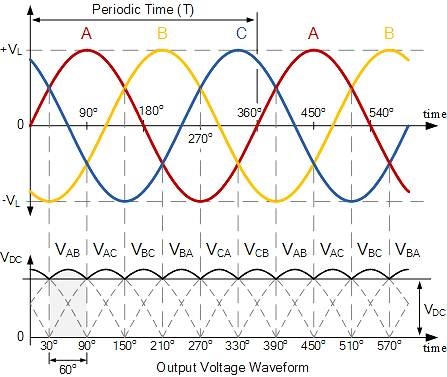
A rectifier converts alternating current (AC) to direct current (DC), as shown in Figure 7. Rectifiers are made up of diodes that act as valves to allow current to flow in one direction only. A Full-wave rectifier, shown in Figure 8, converts the positive and negative half of the alternating current waveform into a positive direct current waveform.
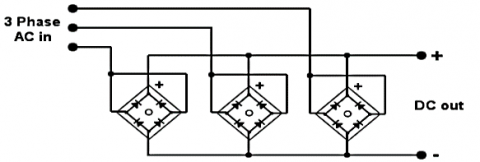
Alternating Current (AC) from the 3-phase synchronous generator if passed through the full-wave rectifier (see Figure 9) to convert the alternating current into Direct Current (DC) suitable for charging the battery bank.
Figure 7. Input/output waveform for a three-phase full-wave rectifier [7]
Figure 8. Full-wave rectifier circuit design used for ac to dc conversion [7]
Figure 9. Full-wave rectifier circuit consisting of three single phase rectifiers
2.9 Photovoltaic Panels (PV)
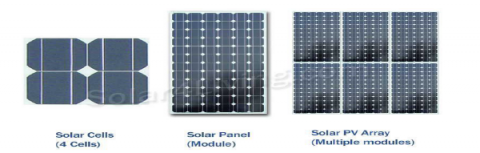
PV Solar Panels (see Figure 10) harness energy from the sun and convert the solar energy into electrical energy through the principle of photovoltaic effect.
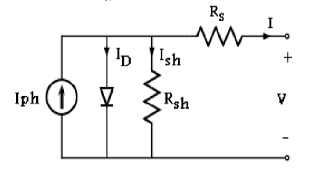
PV Cells consist of a p-n junction made of doped silicon and boron. Where the n-type silicon and p-type silicon meet, free electrons from the free electrons from the n-layer flow into the p-layer for a split second, then form a barrier to prevent more electrons from moving between the two sides. This point of contact and barrier is called the p-n junction. When both sides of the silicon slab are doped, there is a negative charge in the p-type section of the junction and a positive charge in the n-type section of the junction due to movement of the electrons and holes at the junction of the two types of materials. This imbalance in electrical charge at the p-n junction produces an electric field between the p-type and n-type silicon [7]. The equivalent circuit of the solar cell is shown in Figure 11.
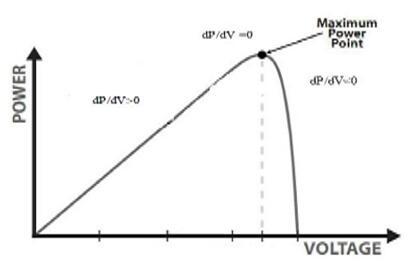
The PV Solar Panel used in our design is 12V 100W solar panel, specifications of which are shown in Table 2 and its voltage characteristics in Figure 12. The table below lists its specifications.
Figure 10. Solar cell, module and array [7]
Figure 11. Equivalent circuit of a solar cell [7]
Table 2. Solar panel specifications
|
Rated Power (Pmax) |
100 W |
|
Maximum Operating Voltage (VMP) |
17.5 V |
|
Optimum Operating Current (Imp) |
5.71A |
|
Open Circuit Voltage (Voc) |
20.5 V |
|
Short Circuit Voltage (Isc) |
6.26A |
|
Maximum Series Fuse |
10A |
|
Power Tolerance |
$\pm$5% |
2.10 Charge controller
A charge controller controls the amount of current and voltage going into a battery and prevents the battery from overcharging and deep discharging. Common controllers are shunt, series, pulse width modulation (PWM) and Maximum Power Point Tracking (MPPT) charge controllers. This design employs a MPPT charge controller for charging efficiency of the batteries, with the charging algorithm shown in Figure 13.
Figure 12. Voltage characteristic of PV array [8]
Figure 13. Flow chart of pv charge algorithm
2.11 Load controller
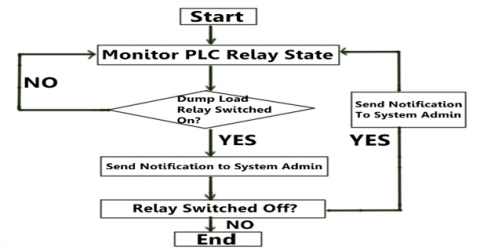
A load controller senses when the battery banks are full and dumps power to a diversion load that utilizes the excess power. The load controller algorithm is shown in Figure 14. A load controller is crucial to the operation of a generator (wind power/hydro power) to prevent the rotor from damaging its internal windings and bearings as a result of heat when the generator is connected without a load and free spins.
The diversion Load controller used to divert excess power from the generator is made using a Programmable Logic Controller (PLC). The DC output from the rectifier is passed through the PLC input relay. The PLC is programmed to sense when the battery bank is full. When full the PLC switches relay and power from the generator is diverted into a dump load.
Figure 14. Flow chart of plc controller algorithm
2.12 Remote manager
An electronic remote management system is employed to monitor different conditions of the system performance. Data is collected, processed and transmitted over a communication system service provider to the end user who is tasked to remotely monitor the system at the receiving end.
A smart antenna system is an antenna array with a control system and digital signal processing system for advanced and intelligent control [12]. It is used in wireless communications for locating mobile devices that are capable of directing their beam radiation in a particular direction. Nowadays, smart antenna technology with improved design contributes significantly to solutions for overcoming issues such as interference and for improving system capacity and efficiency. In this technology, the signal of a mobile device is received by the base station from the direction of the particular area where the mobile device is located. This method of transmission and reception is called beam forming, which is made possible through smart (advanced) signal processing at the baseband [5].
Switch beam/lobe switching systems comprise only of a basic switching function between the separate directive antennas or predefined beams of an array; the setting that gives the best performance is selected. An adaptive array system is an antenna system complete with a direction of arrival signal algorithm for determining the direction towards interference sources on the basis of which the radiation pattern can be adjusted to null out the interferers. Figure 15 [13] shows the basic concepts of both smart antenna systems. The objective is to forward the antenna beam to one specific user, but adaptive array is a more efficient and effective system because it can suppress unwanted beams [14].
Figure 15. Comparison of radiation pattern between optimized beam and desired beam obtained by SNWOM when the number of adaptive array elements is five [13]
Arduino is an open-source electronic based on easy-to-use hardware and software. Arduino boards are able to read inputs-light on a sensor, a finger on a button, or a twitter massage-and turn it into an output-activate motor, turning on a LED, publishing something online. You can tell your board what to do by sending a set of instructions to the microcontroller on the board.
In a smart antenna system, the angle of arrival is one of the factors that determine the precise provenance of the receipt signal by the mobile station. A few techniques and algorithms exist to calculate and estimate the angle of arrival of a signal coming from a mobile device. Consider a signal arriving from N directions, with N angles of arrival, which is received by an antenna array consisting of M elements with M potential weights. Every received signal of x(M)(k), includes additive, zero mean and Gaussian noise [5]. Time k is the represented time sample. Thus, a summary of antenna array output y(k) can be written as follows:
$y(k)=w^{-T} \cdot \bar{x}(k)$ (10)
where,
$\bar{x}(k)=\left[\bar{a}\left(\theta_{1}\right) \bar{a}\left(\theta_{2}\right) \cdots \bar{a}\left(\theta_{N}\right)\right] \cdot\left[\begin{array}{c}s_{1}(k) \\ s_{2}(k) \\ \vdots \\ s_{N}(k)\end{array}\right]+\bar{n}(k)$$=\bar{A} \cdot \bar{s}(k)+\bar{n}(k)$
The numbers of radiation patterns of a typical antenna array can be changed or it can be designed with a determined number of antennas installed. Higher numbers of array elements mean a narrower beam radiation pattern and complex signal processing is required because more elements of the antenna beam need to be calculated. Similar to changes in the relative phase excitation, the orientation of the radiation pattern will change. Each of the N complex signals arrives from various angles $\theta i$ and is intercepted by M antenna elements, where the number of arriving signals N is normally smaller than the number of array antennas M. Eq. (10) represents a summary of the signals arriving from M elements of the antenna, where the vector signal arrives at time k from M angles of arrival. The steering vector contains the responses of all elements of the antenna array to a narrow-band source of power. Because there is a difference in direction between the responses of each of the array antennas, the steering vector is associated with any directional source [5].
The desired signal arrival is (k) to the first element of the array antenna $x 1(k)$ with an angle of $\theta 0$, while the number of interference signals is $i 1(k)-i 5(k)$. For the 6 elements of the array antenna, from $w 1 *-w 6 *$, with 6 potential weights, the array output (k) can be calculated as:
$y(k)=w-H . \bar{x}(k)$ (11)
where,
$\bar{x}(k)=\bar{a}_{0} s(k)+\bar{a}_{1}+\bar{a}_{2}+\bar{a}_{3}+\bar{a}_{4}+\bar{a}_{5}\left[\begin{array}{c}i_{1}(k) \\ i_{2}(k) \\ i_{3}(k) \\ i_{4}(k) \\ i_{5}(k) \\ i_{6}(k) \\ i_{7}(k)\end{array}\right]$$+\bar{n}(k)=\bar{x}_{s}(k)+\bar{x}_{i}(k)+\bar{n}(k)$ (12)
and
$\begin{array}{c} \bar{w}=\left[w_{1} w_{2} w_{3} w_{4} w_{5} w_{6} w_{7} w_{8}\right]^{T} =\text { weight of array antenna } \\ \bar{x}_{s}(k)=\text { desired signal vector arrival } \\ \bar{x}_{i}(k)=\text { signal vector intereference } \\ \bar{n}(k)=\text {zero mean Gaussian noise} \\ for each antenna elemant \\ \bar{a}_{i}=M- element of antenna array steering vector \\ for the \theta_{i} direction of arrical\end{array}$
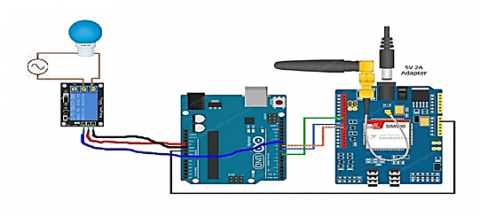
Arduino Uno module shown in Figure 16 is used as a remote system manger to send notification to the system administrator in our design parameter. The flow chart of the system is shown in Figure 17. The Arduino Uno module through the connected battery voltage sensor monitors the battery voltage. When the battery bank is full (14.6V) the PLC controller switches to activate the dump load the Uno module through the connected GMS module boards sends a message to the system administrator of the occurred changes.
Figure 16. Arduino GSM module connected to Arduino uno and 12v relay switch
Figure 17. Arduino GSM remote manager algorithm flowchart
3.1 Civil works
The design parameters of the pico-hydro plant utilizes the run-of-the-river (ROR) design that employs the method of diverting water from the main water source through a canal into a fore bay, through a penstock and to the powerhouse. The fore bay used in this project was the eminence of an old water supply project. The 40mmx100mm diameter penstock pipe was laid out and reinforced with concrete slab along its joins. The turbine stands were fabricated from iron that were cut to size and welded with brackets suitable for mounting the turbine. The floor of the generator house that connects to the tailrace was laid with stones and cemented with concrete along with the turbine stands. The penstock pipe and the construction of the power house are shown in Figure 18 and Figure 19 respectively.
Figure 18. Penstock pipe from the fore bay reinforced with concrete slab
3.2 Mechanical works
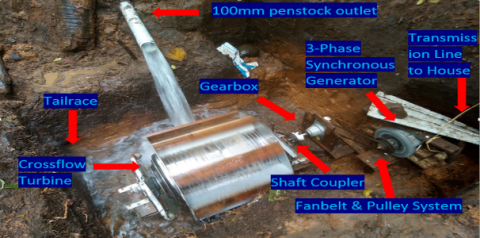
Major mechanical components that were used in the design parameter include the construction and fabrication of the turbine, gearbox and shaft coupler. The overall mechanical system is shown in Figure 20. The generator pulley assembly was also fabricated and mounted to the generator to enable it to connect via a fanbelt to the gearbox. The gearbox’s main function was to increase the r.p.m generated by the turbine while reducing torque. All components except the generator were collected from scrap parts of old washing machines, motors and decommissioned air-conditioning systems.
Figure 19. Powerhouse house construction
Figure 20. Mechanical system overview
3.3 Electrical works
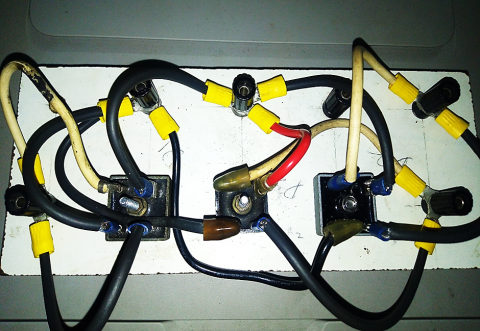
Figure 21 shows the electrical system block diagram, and in Figure 22 the hardware. AC Power generated from the generator is transmitted through a 12 gauge 45m transmission line cable to the house. The transmitted 3-phase AC power is rectified to DC power through full wave Rectifier Bridge built from three 25A 400V single phase rectifiers. The rectified power is fed to the battery for charging. A HR 22MR-DC PLC controller switches relays and activates a 12V heating element when the battery banks are full. The 100W solar panel is connected to a MPPT charge controller that connects to the battery bank. Table 3 shows the total load calculation of the house.
Figure 21. Electrical system block diagram
Figure 22. Electrical system overview
Table 3. Total load calculation of house
|
Load Culculation |
|||||
|
Appliance |
Quantity |
Power Rating (W) |
Time in Use (Hours) |
Total Current (AH) |
Total Power (WH) |
|
Light (LED) |
6 |
8 |
12 |
3.456 |
576 |
|
Light (LED) |
10 |
5 |
12 |
3.6 |
600 |
|
Electric Stove |
1 |
1000 |
2 |
8.333333333 |
2000 |
|
Laptop Charger |
2 |
360 |
4 |
12 |
2880 |
|
Chest Freezer |
1 |
400 |
8 |
20 |
3200 |
|
Water Pump |
1 |
400 |
4 |
12 |
1600 |
|
Electric Ketle |
1 |
1000 |
0.5 |
2.083333333 |
500 |
|
Phone Charger |
6 |
36 |
6 |
5.4 |
1296 |
|
Cumulative Total: |
66.87266667 |
12652 |
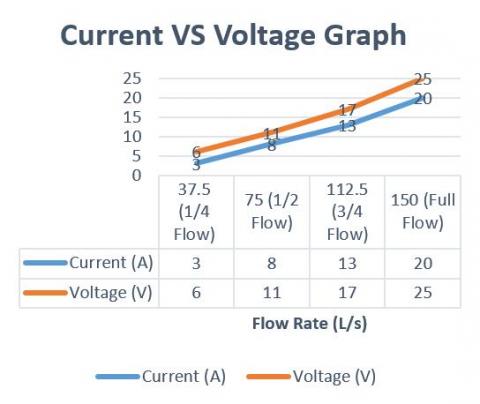
In Figures 23 and 24 are shown the results of the generator performance under different flow rate conditions, the performance of the solar panel through the MPPT charge controller under different weather conditions during the day and their combined input performance into the battery bank.
4.1 Generator performance
The generator produced 500W full power under loaded conditions with a speed of 1000 r.p.m. That power is fed into the battery bank to charge the batteries. It can be seen that the power varies almost linearly with the flow rate and rpm of the rotor excited gear system.
Figure 23. Voltage VS current curve under different flowrate conditions
Figure 24. Power VS Gearbox r.p.m of generator
4.2 Solar panel performance
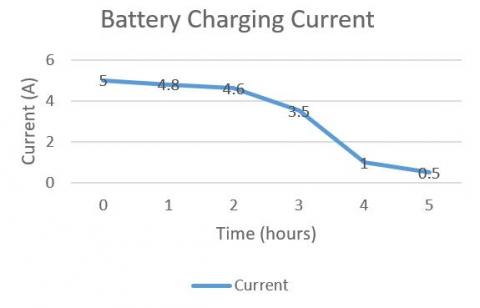
The MPPT controller maximized the charging current through its Maximum Power Point Tracking algorithm until the battery reached near full capacity in the first three hours of the day, as shown in Figure 25. It then dropped the charging current to a minimum to float the battery voltage near the full charge battery capacity.
Figure 25. Input battery charging current measured against time
4.3 Combined input performance
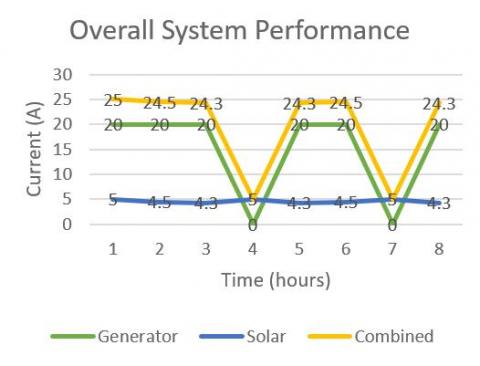
Figure 26 shows the overall system performance of the combined input of the generator and solar. As soon as the battery banks are fully charged, the dump load is activated cutting off the charging current of the generator into the battery bank. As the dump load reduces battery capacity the PLC. relay switches relays disabling the dump load and connecting the generator back to the battery bank. The solar input maintains a constant input and maximises when the generator is disconnected from the battery bank.
Figure 26. Overall system performance of the generator and solar panel combined
Hybrid Pico Hydro _Photovoltaic (PV) plants can be used around Papua New Guinea to enhance the livelihood of people in remote communities around Papua New Guinea and are suitable for both rainy and droughty seasons making it a flexible, versatile and resilient source of generating electricity by combing solar and kinetic energy from flowing water. Scrap parts from discarded equipment can be refurbished and engineered to fabricate generators and turbines instead of ending up ending up in dumping grounds and contributing to pollution. The government and NGOs should take a serious approach to invest in these schemes.
[1] Asmi, A., Shinosh, M. (2007). Fundamentals and modelling of a solar PV system. Science, Measurement and Technology, IEE Proceedings A, 3297: 2320-3765. https://doi.org/10.15662/ijareeie.2015.0406064
[2] Iwale, A.S., Patil, M.V. (2020). An efficient MPPT solar charge controller. International Journal of Advanced Research in Electrical Electronics and Instrumentation Engineering, 3(7): 10505-10511. https://doi.org/10.15662/ijareeie.2014.0307017
[3] Camacho, J.R. (2017). Prospect of small hydropower technology. Renewable Hydropower Technologies, pp. 7-23. https://doi.org/10.5772/66532
[4] Kadir, E.A., Shamsuddin, S.M., Rahman, T.A., Rahim, S.K.A., Supriyanto, E., Rosa, S.L. (2015). AIS algorithm for smart antenna application in WLAN. Journal of ICT Research and Applications, 8(3): 175-194. https://doi.org/10.5614/itbj.ict.res.appl.2015.8.3.1
[5] Ofualagba, G., Okhueleigbe, E. Mini-hydro turbine: Solution to power challenges in an emerging society with abundance of water. American Journal of Engineering and Technology Management, 2(22): 7-12. https://doi.org/10.11648/j.ajetm.20170202.11
[6] Khudhiri, N.A., Dol, S.S., Khan, M.S. (2018). Design of hydro-power plant for energy generation for a mid-size farm with insufficient water distribution networks. 2018 Advances in Science and Engineering Technology International Conferences (ASET), Abu Dhabi, pp. 1-6. https://doi.org/10.1109/ICASET.2018.8376799
[7] Senthilkumar, K.S., Pirapaharan, K., Julai, N., Hoole, P.R.P., Othman, A.H., Harikrishnan, R., Hoole, S.R.H. (2017). Perceptron ANN control of array sensors and transmitters with different activation functions for 5G wireless systems. 2017 International Conference on Signal Processing and Communication (ICSPC), Coimbatore, pp. 107-111. https://doi.org/10.1109/CSPC.2017.8305818
[8] Kavi, M., Aiau, S., Pumwa, J., Pirapaharan, K., Hoole, P.R., Alahakoon, S., Hoole, S.R. (2014). Papua New Guinea national energy roll out plan and the power quality of the distribution systems. Grand Renewable Energy Conference, Japan.
[9] NEROP, Implementing PNG’s Electricity Industry Policy, national stakeholders consultation workshop, Port Moresby, Gateway Hotel, 3-5 December, 2013. Anonymous. Draft Sections C,L,M and Statement of Objectives under the USAID-PNG Electrification Partnership Activity Solicitation, pp. 1-5.
[10] Pirapaharan, K., Kunsei, H., Paul, R., Hoole, S.R. (2016). A single beam smart antenna with a three-element array. Journal of Telecommunication Electronic and Computer Engineering, 8(12): 79-82.
[11] Hoole, P.R.P. (2001). Smart Antennas and Signal Processing in Communication. Medical and Radar Systems, WIT Press, UK.
[12] Rehiara, A., Pasalli, Y.R. (2014). Design planning of micro-hydro power plant in Hink river. Procedia Environmental Sciences, 20: 55-63. https://doi.org/10.1016/j.proenv.2014.03.009
[13] Aiau, S., Kavi, M., Pumwa, J., Pirapaharan, K., Paul, R., Sanath, H. (2014). Renewable energy resource mapping in Morobe province. Papua New Guinea: Solar and Wind Power., Grand Renewable Energy Conference, Japan.
[14] Aiau, S.S., Kavi, M., Pirapaharan, K., Hoole, P.R.P., Anyi, M., Hoole, S.R.H. (2016). PNG’s energy sector and estimation of renewable energy resources in Morobe Province, Papua New Guinea: Solar and wind power for New Umi township. Journal of Telecommunication, Electronic and Computer Engineering, 8(12): 39-46.