Ayodele O. Falade* | John O. Amigun | Olatunbosun O. Kafisanwo
OPEN ACCESS
The study aims to integrate very low frequency electromagnetic method (VLF-EM) and vertical electrical sounding (VES) electrical resistivity methods to determine groundwater prospective in Ilara-Mokin, Akure. VLF profiling was carried out on eight traverses. VLF-EM profiling result showed areas which are relatively conductive with depth and VES stations were positioned based on the results of the VLF-EM survey. Eighteen VES were stationed with maximum electrode separation of 65m along six traverses trending East-West. A total of four geo-electric sections were generated in the N-S, W-E, NE-SW and NW-SE directions revealing at most four geologic layers. The topsoil, clayey/lateritic layer, partially weathered to highly weathered layer and fresh bedrock have resistivity ranging from 105Ωm–445Ωm and a thickness of 0.5m-1.7m, 43Ωm–46Ωm and a thickness of about 6m, 200Ωm–811Ωm and a thickness of 0.5m-21.1m and 1122Ωm–6277Ωm respectively. The H, A, HA and AK curve types in the area revealed that the bedrock in the area is quite close to the surface. Also, the area is resistive as evident with the dominance of A curve type. VES points with H and HA curve types are likely groundwater prospects making the groundwater potential in the area to be rated as fair.
groundwater exploration, vertical electrical sounding (VES), very low frequency electromagnetic method (VLF-EM), aquifer, resistivity, conductivity
Groundwater is not only relied on for primary drinking water supply in many developed and developing countries but also as a source of water for both agriculture and industrial use [1-3]. The universal dependence on groundwater source does not only necessitate the need for commercial quantity but also one with utmost quality [3]. Though, the most comfortable and most convenient way to meet the demand for water is surface water. However, they are unevenly distributed, and in most cases, they are easily prone to pollution. The groundwater, on the contrary, is significantly protected from surface pollution as the earth media (composed of different subsurface layers) act as a natural filter to infiltrated contaminants. Thus, the search for groundwater is more significant as its more dependable than surface water.
Introduction of geophysical methods has made life more comfortable in the exploration world without causing any damage to the earth by using the concept of measuring several physical properties which are related to Earth’s structure and its hidden compositions. The constant demand for water is increasing rapidly with increase in population. Therefore, the search for a more reliable, commercial and cleaner source of water has caused a drift from the conventional techniques to the use of boreholes with the emergence of advanced technologies [4]. Several other researchers have adopted the concept of using electrical resistivity method for groundwater investigation and found it to be reliable [5-15]. There is also reliability of Electrical resistivity method in getting structures appropriate for artificial recharge of groundwater resources among other significance [16]. Many achievements have also been made by integrating several geophysical methods for more accurate and efficient groundwater survey. Many scholars [17-20] have shown the integration of electromagnetic and electrical resistivity geophysical method to be useful in delineating subsurface geologic formation that is favourable to groundwater accumulation. Palacky [21]; Olayinka and Olorunfemi [22]; Omosuyi et al. [23]; Sharma and baranwal [24]; Abiola et al. [25] emphasized the need to conduct a surface geophysical survey such as vertical electrical resistivity Sounding and very low frequency electromagnetic method in identifying the localized aquiferous zones before siting boreholes.
Hence, the target of interest for potable water fit for a domestic, industrial or commercial purpose is the water from weathered/fractured zones in a typical basement complex which prompted this research to investigate the groundwater potential and to delineate the zones which are favourable for groundwater development in the study area.
2.1 Electromagnetic survey
(1) Data acquisition, data processing and presentation
The battery unit of Abem Wadi system supplies power to the control unit and the antenna unit search for a signal. The control unit consists of screen and buttons; values are displayed on the screen (e.g. signal strength, signal frequency, readings for EM profiling) and the buttons for controlling the unit. Electromagnetic VLF-EM profiling was carried out on eight traverses. Six profiles ran from West to East with distance ranging from 50m to 60m and a station interval of 5m, while two traverses with distance ranging from 80m to 90m ran from North to South using 10m interval. Electromagnetic VLF-EM profiling was carried out as a reconnaissance survey to locate conductive zones for the location of the VES points
The VLF data obtained are presented as profiles and sections. The profiles are interpreted qualitatively through visual inspection. Cross over points are identified at the points of inflexion. According to Poddar and Rathor [26], conductive zones are identified using the maximum point of filter real and the inflexion point of the raw real.
2.2 Electrical resistivity method
(1) Data acquisition, data processing and presentation
The first step was to pick the sounding points from the conductive zones on the VLF-EM sections and carry out a geophysical investigation involving Electrical resistivity method using vertical electrical soundings (VES) technique. Eighteen VES points were sounded as shown in Figure 1. The electrode spacing (AB/2) was varied from 1m to 65m giving a total spread length of 130m at each location. A low frequency electric current (I) was passed into the ground through a pair of current electrodes while the resulting potential difference (∆V) was measured across another pair of potential electrodes located within the current electrode pair.
Resistivity data are presented as sounding curves, profiles, pseudo-section and maps. The interpretation could be made either qualitatively or quantitatively. The qualitative interpretation involves a visual inspection of profiles, maps, and pseudo-sections while the quantitative interpretation involves partial curve matching and computer iteration. The quantitative interpretation gives the approximate resistivity values of the earth material. The interpretation result is presented as the geo-electric section.
Vertical Electrical Sounding (VES) results were obtained and the curves generated were matched with standard master curves and auxiliaries (partial curve matching technique). This involves segment by segment matching of the sounding curves with two theoretical layer master curves and model auxiliary curves. The field curve plotted on a tracing paper is placed on a master curve, and when a good fitting is obtained, the coordinate on the bi-log will give the resistivity and thickness of the layer which will be used to model the curve before iteration. These results were used for the computation of overburden thickness and calculation of traverse resistance for each VES point.
3.1 Location of study area
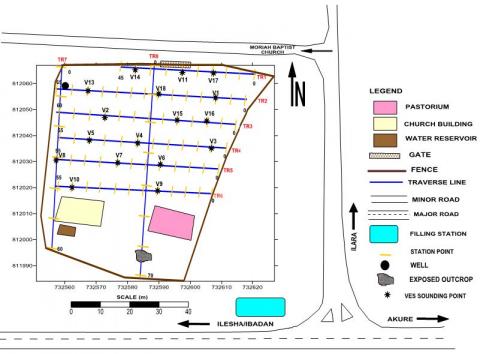
The study area is located at Moriah Baptist church, Ilara-Mokin, Akure, South-western part of Nigeria and is bounded by Northing coordinate 811990N and 812060N and the Easting coordinate 732560E and 732620E in Universal Traverse Mercator (UTM) within the basement complex of Nigeria. The study location is part of the areas underlained by the Precambrian basement complex rocks in Southwestern Nigeria.
3.2 Geology of study area
The study area is situated in the basement complex of southwestern Nigeria with the Precambrian crystalline rocks consisting mainly of biotitic gneisses, charnockitic rocks, quartzites and granites [27]. The biotitic gneiss is the oldest rock unit in the area. In some regions, biotitic gneiss is found associated with the charnockitic rock and is made up of biotitic feldspar and quartz which range from fine to medium grained. Charnockitic rocks are the most extensive rocks unit in the site [28]. This rock consists of minerals such as pyroxene, amphibole ranging from fine to medium grained. Quartzite and Granite that is rich in feldspar and quartz also occurs with the charnockitic rocks which dominate most of the study area.
Figure 1. Base map of the study area showing the VES points
Figure 2. Geological map of Akure and its environment [29]
4.1 VLF-EM results and discussion
(1) VLF-EM results
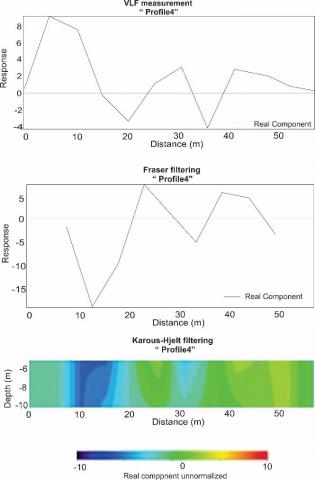
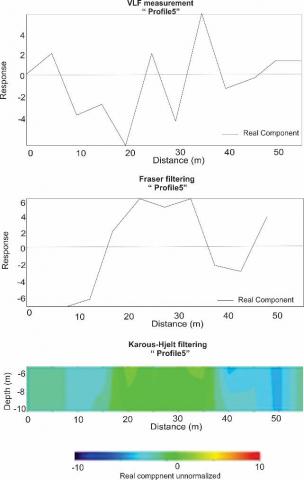
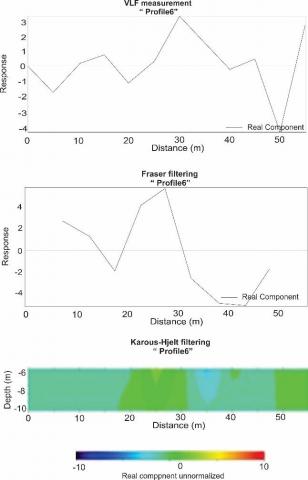
A total of eight traverses were mapped out in the study area for VLF-EM profiling with six traverses running from East to West and two traverses along North to South direction. The VLF-EM field data acquired (Raw real and Filter real) were plotted against distance (m) and correlated with the KH-contours as shown in Figures 3a-3h (Traverse 2 is an exception where filtered real was also plotted against distance).
(2) VLF-EM discussion
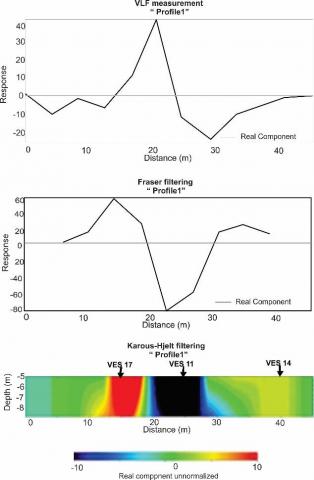
The figures 3a - 3h above show the interpretation of VLF-EM data presented in the form of profiles and pseudo-sections. The profiles are interpreted qualitatively which involves the visual inspection of points (i.e. looking out for where positive amplitude peaks of filter real coincide with the inflexion point of the raw real components of the electromagnetic field). These points indicate prospective presence of a conductive material. The pseudo-section generated through the use of Karous Hjelt filters gives a quantitative interpretation of the VLF-EM data. Based on this interpretation, three traverses (1, 2, and 7) proved to be of interest.
Figure 3a illustrates the profile and pseudo-section generated along traverse 1 oriented in the E-W direction. Points indicative of relatively highly conductive zones were found within a depth of 10 m to 20 m. This might imply the presence of fracture. Relatively highly resistive zone was also observed within the depth 20 m and 27 m. This might be the effect of basement complex. These points were selected for further investigation using Vertical Electrical Sounding.
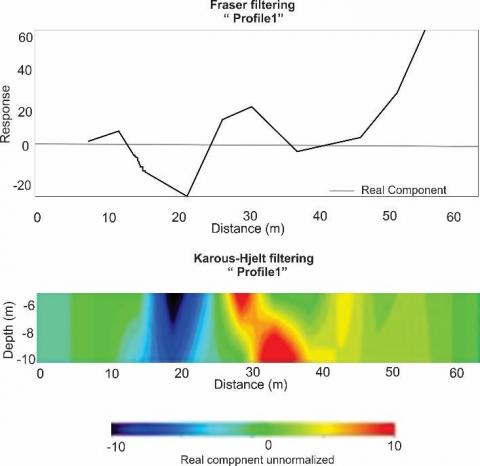
Figure 3b illustrates the profile and pseudo-section generated along traverse 2 also oriented in E-W direction. Points indicative of conductive zone ranges from about 5 m to about 50 m with a resistive body at a distance of about 24 m to 29 m and depth of 9 m. These points were also selected for further investigation using Vertical Electrical Sounding.
Figure 3g illustrates the profile and pseudo-section generated along traverse 7 oriented N-S direction. This profile was selected as it cut across all the traverses trending in E-W direction. Points indicative of conductive zones range from about depth of 49 m to about 66 m, and these points were also selected for further investigation using VES.
a. VLF-EM Profile and KH filter Pseudo-section for Traverse 1 (E-W)
b. VLF-EM Profile and KH filter Pseudo-section for Traverse 2 (E-W)
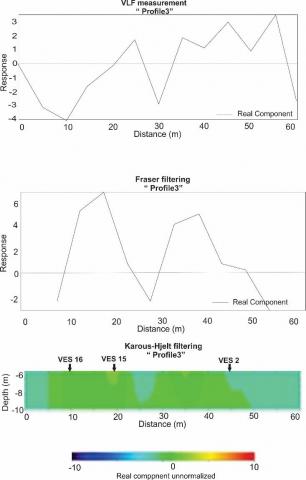
c. VLF-EM Profile and KH filter Pseudo-section for Traverse 3 (E-W)
d. VLF-EM Profile and KH filter Pseudo-section for Traverse 4 (E-W)
e. VLF-EM Profile and KH filter Pseudo-section for Traverse 5 (E-W)
f. VLF-EM Profile and KH filter Pseudo-section for Traverse 6 (E-W)
g. VLF-EM Profile and KH filter Pseudo-section for Traverse 7 (N-S)
h. VLF-EM Profile and KH filter Pseudo-section for Traverse 8 (N-S)
Figure 3. VLF-EM Profiles and KH Filter Pseudo-section
4.2 VES results and discussion
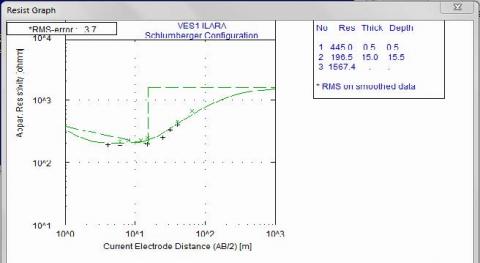
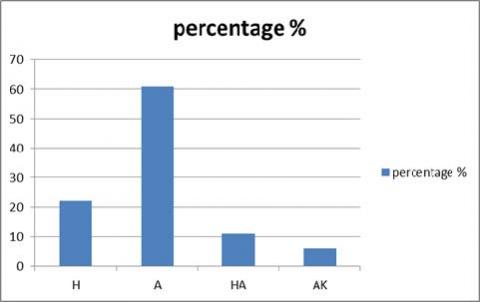
A total of eighteen (18) points were sounded using the Schlumberger array of electrical resistivity method. The maximum spread (AB) is 130m (i.e. AB/2=65m). The VES data generated from the study area as shown in Tables 1 and 2 were interpreted using the partial curve matching method, and iteration was done using the WINRESIST software to know their curve types. However, only seven points (VES1, 8, 11, 13, 14, 17, 18) fall within the traverse of interest. The curve types gotten for all the VES points are H (figure 4a), A (figure 4b), HA (figure 4c) and Ak (figure 4d), which is also explained better in Table 3. Majority of the points sounded have A curve type (61 %), 22 % are H curve type, 11 % are HA curve type while 6 % is AK curve type Figure 5. This analysis showed that the bedrock in the area is relatively close to the surface. Though the few points with H and HA curves (VES 1, 8, 9, 10, 17 and 18) are likely prospects for groundwater potential.
4.3 Geo-electric sections
A total of four geo-electric sections were generated in the N-S, W-E, NE-SW and NW-SE directions. These geo-electric sections revealed at most four (4) geologic layers as shown in Figure 5a-5d. The first layer is the topsoil, having layer resistivity range of 105 Ωm - 445 Ωm and layer thickness from 0.5 m - 1.7 m. The second layer is the clay layer with layer resistivity range of 43 Ωm – 46 Ωm and a layer thickness of about 6 m. The third comprises of partially weathered to highly weathered layer with layer resistivity ranging from 200 Ωm – 811 Ωm and a layer thickness range of 0.5 m - 21.1 m. The fourth layer is the fresh basement having layer resistivity range from 1122 Ωm – 6277 Ωm.
Table 1. VES data for points 1 to 9
|
S/N |
AB/2 |
VES 1 |
VES 2 |
VES 3 |
VES 4 |
VES 5 |
VES 6 |
VES 7 |
VES 8 |
VES 9 |
|
1 |
1 |
298 |
173 |
172 |
268 |
281 |
236 |
158 |
278 |
230 |
|
2 |
2 |
215 |
174 |
174 |
313 |
244 |
178 |
165 |
224 |
201 |
|
3 |
3 |
193 |
178 |
182 |
294 |
227 |
180 |
173 |
198 |
200 |
|
4 |
4 |
191 |
182 |
181 |
303 |
247 |
198 |
188 |
207 |
217 |
|
5 |
6 |
188 |
193 |
203 |
326 |
265 |
236 |
175 |
231 |
200 |
|
6 |
6 |
218 |
194 |
212 |
337 |
279 |
231 |
178 |
208 |
199 |
|
7 |
8 |
224 |
201 |
201 |
351 |
287 |
269 |
201 |
241 |
181 |
|
8 |
12 |
226 |
221 |
214 |
385 |
319 |
280 |
226 |
294 |
167 |
|
9 |
15 |
247 |
230 |
267 |
437 |
336 |
285 |
241 |
353 |
175 |
|
10 |
15 |
197 |
212 |
248 |
345 |
300 |
284 |
257 |
329 |
175 |
|
11 |
25 |
251 |
235 |
344 |
433 |
374 |
374 |
327 |
471 |
240 |
|
12 |
32 |
329 |
266 |
459 |
563 |
464 |
459 |
347 |
524 |
279 |
|
13 |
40 |
400 |
343 |
481 |
685 |
540 |
539 |
418 |
685 |
422 |
|
14 |
40 |
457 |
344 |
449 |
594 |
542 |
535 |
383 |
593 |
423 |
|
15 |
65 |
664 |
570 |
790 |
1026 |
784 |
758 |
632 |
845 |
577 |
Table 2. VES data for Points 10 to 18
|
S/N |
AB/2 |
VES 10 |
VES 11 |
VES 12 |
VES 13 |
VES 14 |
VES 15 |
VES16 |
VES17 |
VES18 |
|
1 |
1 |
346 |
300 |
95 |
103 |
150 |
100 |
146 |
150 |
145 |
|
2 |
2 |
262 |
272 |
129 |
155 |
160 |
137 |
172 |
123 |
110 |
|
3 |
3 |
262 |
253 |
186 |
239 |
178 |
235 |
182 |
105 |
108 |
|
4 |
4 |
263 |
238 |
223 |
251 |
230 |
283 |
196 |
80 |
76 |
|
5 |
6 |
247 |
302 |
220 |
279 |
270 |
308 |
206 |
54 |
65 |
|
6 |
6 |
253 |
305 |
223 |
280 |
271 |
309 |
208 |
55 |
65 |
|
7 |
8 |
258 |
460 |
220 |
295 |
265 |
325 |
227 |
60 |
64 |
|
8 |
12 |
308 |
600 |
231 |
270 |
252 |
348 |
235 |
80 |
78 |
|
9 |
15 |
353 |
750 |
236 |
278 |
245 |
365 |
240 |
96 |
95 |
|
10 |
15 |
321 |
751 |
236 |
279 |
244 |
365 |
242 |
98 |
94 |
|
11 |
25 |
423 |
1273 |
320 |
315 |
334 |
473 |
442 |
130 |
150 |
|
12 |
32 |
536 |
1358 |
325 |
375 |
434 |
700 |
515 |
150 |
185 |
|
13 |
40 |
601 |
1499 |
402 |
503 |
503 |
88 |
553 |
220 |
239 |
|
14 |
40 |
690 |
1500 |
402 |
503 |
503 |
881 |
553 |
222 |
302 |
|
15 |
65 |
764 |
2522 |
600 |
780 |
584 |
1002 |
956 |
298 |
395 |
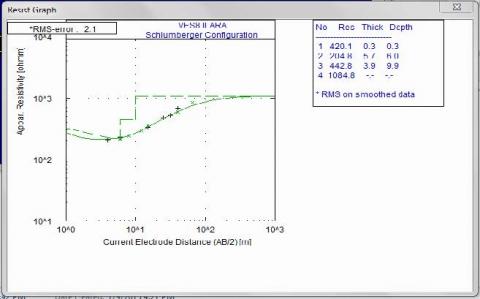
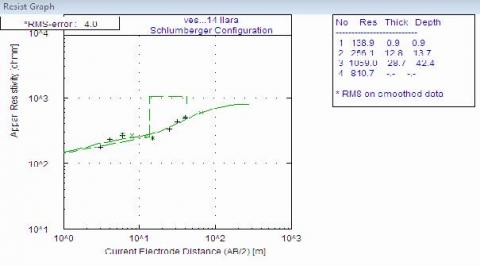
a. H curve type typically observed in the study area
b. A curve type typically observed in the study area
c. HA curve type typically observed in the study area
d. AK curve type typically observed in the study area
Figure 4. Curve types typically observed in the study area
Figure 5. Percentage Distribution of the VES curve types
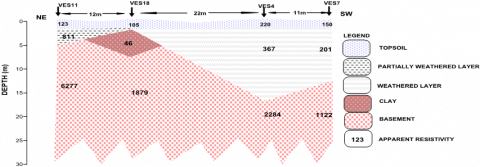
Figure 6a is a geo-section of VES points 11, 18, 4, 7 which comprises of the topsoil, clay formation, weathered to partially weathered layer and a basement layer. From the figure, there is a depression towards the Southwest of the geo-section which is suitable for accumulation of groundwater.
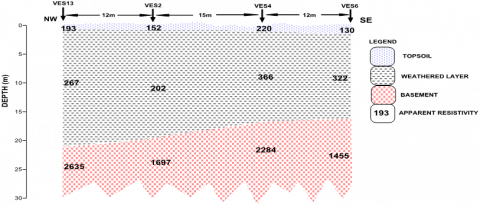
Figure 6b shows VES points 13, 2, 4, 6 on the geo-section comprising of three (3) layers including the topsoil, weathered layer and the basement rock. The section depicts a very thick overburden ranging from 0.5m to 21m which seems favourable to groundwater, but there is no significant structure such as fracture which is favourable to groundwater.
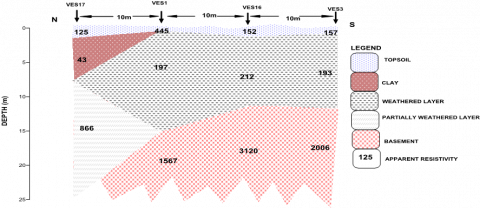
Figure 6c is a geo-section of VES points 17, 1, 16, 3 which comprises of the topsoil, clay formation, weathered to partially weathered layer and a basement layer. From the figure, there is a depression towards the Southwest of the geo-section which is suitable for accumulation of groundwater.
Figure 6d is also a geo-section of VES points 5, 4, 3 which comprises of three (3) layers including the topsoil, weathered layer and the basement rock. The section depicts a very thin overburden ranging from 0.5 m to 2 m which means the bed rock is close to the surface.
Table 3. Summary of VES results
|
VES NUMBER |
NO OF LAYERS |
Resistivity (Ohm-m) ρ1/ρ2/…ρn-1 |
CURVE TYPE |
Depth(m) d1 /d2 /…dn-1 |
|
VES1 |
3 |
445/196.5/1567.4 |
H |
0.5/15.5 |
|
VES2 |
3 |
152/202.1/1696.6 |
A |
1.0/19.8 |
|
VES3 |
3 |
157.0/193.8/2006.4 |
A |
0.9/11.7 |
|
VES4 |
3 |
220.3/366.8/2283.5 |
A |
1.2/16.8 |
|
VES5 |
3 |
169.6/344.4/1499.2 |
A |
1.4/18.9 |
|
VES6 |
3 |
129.6/321.5/1455.0 |
A |
1.5/16.3 |
|
VES7 |
3 |
150/200.7/1122.4 |
A |
1.2/12.5 |
|
VES8 |
4 |
420.1/204.8/442.8/1084.8 |
HA |
0.3/6.0/9.9 |
|
VES9 |
3 |
324.7/144.1/2011.8 |
H |
1.7/14.1 |
|
VES10 |
4 |
380.9/113.7/240.7/1147.1 |
HA |
1.1/1.4/8.7 |
|
VES11 |
3 |
122.6/810.8/6276.5 |
A |
1.7/5.1 |
|
VES12 |
3 |
133.7/233.2/1321.3 |
A |
0.8/17.3 |
|
VES13 |
3 |
192.9/266.5/2634.5 |
A |
0.6/21.1 |
|
VES14 |
4 |
138.9/256.1/1059/810.7 |
AK |
0.9/13.7/42.4 |
|
VES15 |
3 |
139.9/327.9/2753.4 |
A |
0.8/11.8 |
|
VES16 |
3 |
151.8/212.3/3120.3 |
A |
1.2/11.4 |
|
VES17 |
3 |
125.0/43/866.4 |
H |
1.5/7.7 |
|
VES18 |
3 |
104.5/45.8/1879.3 |
H |
1.7/7.7 |
a. Geo-electric Section for VES 11, 18, 4, 7 (NE-SW)
b. Geo-electric Section for VES 13, 2, 4, 6 (NE-SW)
c. Geo-electric Section for VES 17, 1, 16, 3 (NE-SW)
d. Geo-electric Section for VES 5, 4, 3 (NE-SW)
Figure 6. Geoelectric Sections Along Traverses
An Integrated geophysical investigation involving reconnaissance survey, Very Low Frequency (VLF) Electromagnetic method and electrical resistivity method has been adopted for groundwater investigation at Moriah Baptist church, Ilara-Mokin, along Akure-Ibadan road, Southwestern part of Nigeria. A total of eight (8) traverses were mapped in the study area (six profiles along E-W and two running N-S) with eight (8) VLF profiles on each traverse. The VLF-EM mapped the conductive zones in the study area on which the Vertical Electrical Sounding VES was conducted which are probably weathered or fracture zones. Eighteen (18) vertical electrical sounding data were also acquired using the Schlumberger configuration. From the interpretation of the VES data using partial curve matching and iteration using WINRESIST, different curve types which include the A, H, HA, and AK curves were generated. However, the likely prospects for groundwater potential are VES points 1, 8, 9, 10, 17 and 18 with H, HA, H, HA, H and H respectively. The dominant A curve type in the area indicates that the area is more resistive; therefore, groundwater potential in this area can be rated as fair. The geo-electric section delineated four (4) subsurface geologic layers (topsoil, clay, weathered layer and basement). In conclusion, integrating Electromagnetic method (VLF-EM) and Electrical resistivity method (VES) is suitable for and aid groundwater development exploration. Based on the interpreted results obtained from reconnaissance survey and geophysical survey, it is recommended that groundwater conductivity and borehole logging can be adapted to characterize the aquifer for better integration results.
|
VLF-EM |
Very Low Frequency Electromagnetic Method |
|
VES |
Vertical Electrical Sounding |
[1] Olafisoye, E.R., Sunmonu, L.A., Ojoawo, A., Adagunodo, T.A., Oladejo, O.P. (2012). Application of very low frequency electromagnetic and hydrophysicochemical methods in the investigation of groundwater contamination at Aarada waste disposal site, Ogbomoso, Southwestern Nigeria. Australian Journal of Basic & Applied Sciences, 6: 401-409.
[2] Akinrinade, O.J., Adesina, R.B. (2016). Hydrogeophysical investigation of groundwater potential and aquifer vulnerability prediction in Basement complex terrain – A case study from Akure, Southwestern Nigeria. Materials and Geoenvironment, 63(1): 55-66. https://doi.org/10.1515/rmzmag-2016-0005
[3] Emenike, C.P., Tenebe, I.T., Omole, D.O., Ngene, B.U., Oniemayin, B.I., Maxwell, O., Onoka, B.I. (2017). Accessing safe drinking water in Sub-saharan Africa: issues and challenges in Southwest Nigeria. Sustainable Cities and Society, 30: 263-272. https://doi.org/10.1016/j.scs.2017.01.005
[4] Alile, M.O., Jegede, S.I., Ehigiator, O.M. (2008). Underground water exploration using electrical resistivity method in Edo state, Nigeria. Asian Journal of Earth Science, 1(1): 38-42. http://dx.doi.org/10.3923/ajes.2008.38.42
[5] Olorunfemi, M.O., Fasuyi, S.A. (1993). Aquifer types and the Geoelectric/Hydrogeologic characteristics of part of the central basement terrain of Nigeria (Niger state). Journal of African Earth Sciences, 16(3): 309-317. http://dx.doi.org/10.1016/0899-5362(93)90051-Q
[6] Olorunfemi, M.O., Ojo, J.S., Akintunde, O.M. (1999). Hydro-geophysical evaluation of the groundwater potentials of the Akure Metropolis, Southwestern Nigeria. Journal of Mining and Geology, 35(2): 207-228.
[7] Awomeso, A., Orebiyi, O., Oyedokun, O. (2008). Geophysical investigation for groundwater exploration in a crystalline basement, Southwestern Nigeria. New York Science Journal, 19-35.
[8] Al-Garni, M.A. (2009). Geophysical investigation for groundwater in a complex surface terrain, Wadi Fatima, KSA: A case history: Jordan. Journal of Civil Engineering, 3: 118-136.
[9] Ehirim, C.N., Nwankwo, C.N. (2010). Evaluation of aquifer characteristics and groundwater-quality using geo-electric method. Archives of Applied Science Researcher, 2(2): 396-403.
[10] Amigun, J.O., Owolabi, S.T., Adiat, K.A.N. (2012). Geophysical investigation at a proposed residential estate in Ibadan of Nigeria: Hydrological and geotechnical implication. Journal of Emerging Trends in Engineering and Applied Sciences (JETEAS), 3(2): 368-374.
[11] Lateef, T.A. (2012). Geophysical investigation for groundwater using electrical resistivity method - A case study of annunciation grammar school, Ikere Lga, Ekiti State, South-Western Nigeria. IOSR Journal of Applied Physics (IOSRJAP), 2(1): 1-6.
[12] Oyedele, E.A., Olayinka, A.I. (2012). Statistical evaluation of groundwater potential of Ado-Ekiti, Southwest, Nigeria. Transnational Journal of Science and Technology, 2(6): 110.
[13] Akintorinwa, O.J., Olowolafe, T.S. (2013). Geoelectric evaluation of groundwater prospect within Zion Estate, Akure, Southwestern, Nigeria. International Journal of Water Resources and Environmental Engineering, 5(1): 12-28.
[14] Longpia, C.B., Dakwo, P.D., Ramadan, J.A., Ikeh, J.O., Offodile, C.J. (2017). Integrated use of geo-electrical resistivity sounding and hydrogeologic investigation methods for groundwater resource development around obu-okpella South-Western Nigeria. IOSR Journal of Applied Geology and Geophysics (IOSR-JAGG), 5(3): 48-56. https://doi.org/10.9790/0990-0503024856
[15] Ajayi, T., Awotuyi, B., Bello, R. (2019). Geoelectric assessment of groundwater potential in Supare Akoko, southwestern, Nigeria. Environmental and Earth Sciences Research Journal, 6(2): 59-70. https://doi.org/10.18280/eesrj.060202
[16] Sanjeev, R. (2017). Geophysical resistivity survey (VES) for selection of appropriate artificial recharge (Ar) structures for augmentation of groundwater resources in Gwalior, M.P, India, Environmental and Earth Sciences Research Journal, 4(1): 7-11. https://doi.org/10.18280/eesrj.040102
[17] Benson, A.K., Payne, K.L., Stubben, M.A. (1997). Mapping groundwater contaminating using DC resistivity and VLF geophysical methods - A case study. Geophysics, 62: 80-86. http://dx.doi.org/10.1190/1.1444148
[18] Olasehinde, P.I., (1999). An integrated geological and geophysical exploration technique for groundwater in the basement complex of west central part of Nigeria. Journal of National Association of Hydrogeologist (Water Resources), 10(1): 46-49.
[19] Omosuyi, G.O., Adegoke, A.O., Adelusi, A.O., (2008). Interpretation of electromagnetic and geoelectric sounding data for groundwater resources around Obanla-Obakekere, near Akure, Southwestern Nigeria. Pacific Journal of Science and Technology, 9(2): 509-525.
[20] Adelusi, A.O., Ayuk, M.A., Kayode, J.S. (2014). VLF-EM and VES: An application to groundwater exploration in a Precambrian basement terrain SW Nigeria. Annals of Geophysics, 57(2): s0184. https://doi.org/10.4401/ag-6291
[21] Palacky, G.J., (1989). Advances in geological mapping with airborne electromagnetic systems. Exploration '87 Proceedings - Third Decennial International Conference on Geophysical and Geochemical Exploration for Minerals and Groundwater, 137-152.
[22] Olayinka, A.T., Olorufemi, M.O. (1992). Determination of geo-electrical characteristics in Okene area and implications for borehole siting. Journal of Mining & Geology, 28(2): 403-412.
[23] Omosuyi, G.O., Ojo, J.S., Enikanselu, P.A. (2003). Geophysical investigation for groundwater around obanla – Obakekere in Akure Area within the Basement Complex of South-Western Nigeria. Journal of Mining and Geology, 39(2): 109-116.
[24] Sharma, S.P., Baranwal, V.C. (2005). Delineation of groundwater-bearing fracture zone in a hard rock area integrating very low frequency electromagnetic and resistivity data. Journal of Applied Geophysics, 57(2): 155-166. http://dx.doi.org/10.1016/j.jappgeo.2004.10.003
[25] Abiola, O., Enikanselu, P.A., Oladapo, M.I. (2009). Groundwater potential and aquifer protective capacity of overburden units in Ado-Ekiti, Southwestern Nigeria. International Journal of Physical Science, 4(3): 120-132.
[26] Poddar, M., Rathor, B.S. (1983). VLF survey of the weathered layer in Southern India. Geophysical Prospecting EAGE. Wiley Online Library. https://doi.org/10.1111/J.1365-2478.1983.Tb01067.X
[27] Rahaman, M.A. (1976). A review of the basement geology of Southwestern Nigeria. In Kogbe, C.A. (Editor), Geology of Nigeria. Elizabethan Publishing Co. 41-58.
[28] Olarewaju, V.O. (1987). Charnokitic-granite association in SW Nigeria: Rapakivi granite type and charnokitic Plutonism in Nigeria. Journal of African Earth Science, 6(1): 67-77. https://doi.org/10.1016/0899-5362(87)90108-4.
[29] Oladapo, M.I., Adeoye-Oladapo, O.O., Mogaji, K.A. (2009). Hydrogeophysical study of the groundwater potential of Ilara-Mokin Southwestern Nigeria. Global Journal of Pure and Applied Sciences, 15(2): 195-204. http://dx.doi.org/10.4314/gjpas.v15i2.45385