Zibei Ren | Ming Li | Yanzhe Hui* | Zengwang Ma | Jiancai Gu
© 2021 IIETA. This article is published by IIETA and is licensed under the CC BY 4.0 license (http://creativecommons.org/licenses/by/4.0/).
OPEN ACCESS
Soil desertification affects the service functions of the ecosystem. In severe cases, it even causes a decline in agricultural productivity and shrinkage of animal husbandry, posing a threat to regional eco-environment and economic sustainability. The previous research on soil remediation research mainly concentrates on heavy metal degradation, saline soil improvement, and eroded and degraded soil improvement. There is little report on the biomass improvement and restoration of sandy soil. Therefore, this paper explores the remediation effect of biomass amendment on the physical-chemical performance and sustainable utilization of sandy soil in Huangyangtan, the largest sandy land in northern China’s Hebei Province. Specifically, the authors detailed the strategies to measure the physical-chemical indices and microbial diversity of Huangyangtan sandy soil, and introduced the materials and mode of the biomass amendment test on Huangyangtan sandy soil, followed by an elaboration on the test results. The influence of different test fertilizers on the soil was analyzed in four dimensions, namely, physical performance, chemical performance, biological performance, and crop yield. The results show that biomass amendment can effectively remediate sandy soil, and promote its sustainable utilization.
biomass amendment, sandy soil, Huangyangtan, soil remediation, physical-chemical performance, sustainable utilization
There are several urgent issues to be solved in agricultural production of China, namely, secondary salinization, acidification, desertification, high heavy metal content, and quality degradation. In recent years, biomass amendment provides a new solution for soil remediation, with features like rich carbon, fine particle size, and high porosity. Nature hails “biomass improvement and its application” as one of the world’s top 15 environmental issues [1-4]. Chinese and foreign scholars have explored extensively into the porosity, saturated water content, cation exchange capacity, and organic matter ratio of soil after the addition of biomass amendment, and further investigated the action mechanism of biomass amendment on farmland soil with microbial diversity, an indicator of the status of the soil ecosystem [5-8].
After entering the soil environment, the heavy metals cannot be biodegraded. If they find their ways into the human body, the human might suffer from chronic poisoning and even death [9-12]. To repair the soil contaminated by heavy metals and fully utilize resources, Rocco et al. [13] took the biochar produced through sludge pyrolysis as a biomass amendment to remediate soils in areas severely polluted by heavy metals; the sludge pyrolysis biochar features a porous structure, rich nutrient elements, and stable carbon elements. Then, they tested different mix ratios of sludge and sludge pyrolysis biochar, identified the optimal mix ratio that leads to the best remediation effect, and evaluated the biological risk of soil heavy metals after the application of biomass amendment. McWatters et al. [14] prepared two kinds of biochar from corn stalks and high-concentration fermentation waste liquid, and synthetized them into an amendment for sandy and contaminated soils; through pot tests, the physical-chemical performance in sandy soil was studied under different application ratios; the results demonstrate that the sludge-straw biomass amendment can fix and passivate the heavy metal elements Pb and Cr in the soil. Focusing on farmland soil in mining areas, Soltaninejad et al. [15] characterized the physical-chemical properties of the biomass amendment developed from rice straw through elemental analysis, Fourier infrared spectroscopy, and specific surface area analysis, and verified that the prepared amendment can stabilize heavy metals Cu, Cd, As, and Zn in the soil through biomass amendment-soil culture experiment in simulated natural environment. Vidonish et al. [16] tackled three modified biomass amendments compounded with ZnO, MnO and chitosan, respectively, and extracted the heavy metal distribution on each amendment under physical, chemical, and other types of adsorption; on this basis, the adsorption process was described realistically by setting up a Langmuir isotherm adsorption model and a quasi-second-order kinetic model, and the different effects between the amendments were verified in terms of the complexation of oxidation functional groups, the adsorption effect of mineral precipitation, and bio-availability.
Biomass amendment, with certain absorbability, can inactivate heavy metal ions in the soil, and improve the water and fertilizer retention in the soil to a certain extent [17-19]. Dias-Ferreira et al. [20] improved the water content, available phosphorus, alkali hydrolyzable nitrogen, and organic matter eroded and degraded farmland soil, which effectively alleviates the crop failure induced by soil erosion and degradation. Balawejder et al. [21] took pertinent measures to improve the alkali lime soil in karst regions, which faces problems like calcium enrichment, low fertility, and poor aggregate structure; many pot experiments were conducted to compute and check the optimal particle size and charcoal-soil ratio of the biomass amendment; the results confirm that applying biomass amendment can boost the natural water content and enzyme activity of lime soil, and greatly promote soil improvement and vegetation growth. Soobhany [22] combined polymeric aluminum ferric sulphate (PAFS) and biomass amendment to improve the severely salinized and alkalized soda saline-alkaline soil, proved that the combined method can reduce the pH and volume weight of soil, and thus enhance the saturated water holding capacity; furthermore, the mix ratio of the two amendments were rationalize to balance the contents of water-soluble ions, such as Na+, K+, Cl-, CO32-, HCO3-, Ca2+, Mg2+, and SO42-.
As the most harmful way of land degradation, soil desertification not only affects ecosystem services, but also leads to decline in agricultural productivity and shrinkage of animal husbandry, threatening regional eco-environment and economic sustainability [23-26]. However, there is little report on the biomass improvement and restoration of sandy soil. Therefore, this paper collects the field survey data of 11 consecutive years about the vegetation on grasslands with different degrees of desertification in Huangyangtan, the largest sandy land in northern China’s Hebei Province. Then, the authors explored the remediation effect of biomass amendment on the physical-chemical performance and sustainable utilization of sandy soil, aiming to provide a scientific basis for ecological reconstruction and vegetation restoration in the study area. Section 2 details the strategies to measure the physical-chemical indices and microbial diversity of Huangyangtan sandy soil; Section 3 introduces the materials and mode of the biomass amendment test on Huangyangtan sandy soil; Section 4 elaborates on the test results, including the influence of different test fertilizers on the soil in terms of physical performance, chemical performance, biological performance, and crop yield, and thus verifies the positive effect of biomass amendment on the restoration and sustainable utilization of the sandy soil in Huangyangtan.
Huangyangtan sandy land is dominated by aeolian sandy soil, which was formed mainly through wind erosion and wind deposition. In terms of texture, the sandy soil is mostly silty sand and gravel sand; in terms of zonality, the soil belongs to mountain brown soil, with a low organic matter content and a large particle size. Due to sand burial and sand hitting, semi-fixed and mobile sand-covered grasslands have formed between sand ridges.
The test area is the transition zone from the semi-humid zone to the semi-arid zone in Xuanhua County, Zhangjiakou, Hebei Province. Wind erosion and wind deposition have turned the area into a sandy land dominated by aeolian sandy soil. Lacking diversified vegetation, the test area (total area: 10.2×10⁴km2; elevation: 600-1,000m) faces harsh natural conditions and frequent meteorological disasters. The annual mean rainfall, evaporation, wind speed, and temperature are 400.3mm, 1,862.5mm, 2.9km/h, and 7.6℃, respectively.
2.1 Measurement of physical-chemical indices
The sample soil was passed through a soil sieve to remove large particles and plant fibers. By wet sieving method, the diameter and weight ratio were determined for different grades of soil aggregates. On this basis, weight coefficients were configured, and used to obtain the weighted mean of the measured diameters. The mean diameter characterizes the stability of the soil aggregates. Let di and K be the diameter and number of apertures on sieve i, respectively; pi be the weight ratio of clusters on sieve i; wi be the weight of pi. Then, the stability coefficient of soil aggregates can be calculated by:
$\gamma =\sum\limits_{1}^{K}{\frac{{{d}_{i+1}}+{{d}_{i}}}{2}{{w}_{i}}}$ (1)
To accurately measure the water holding capacity of each test sample, the soil was immersed in water for 24h to reach saturation, and dried for 6h. Then, the mass of the soil in saturated water holding state M1, and the mass of the soil dried to constant weight M2 were measured separately. Thus, the water holding capacity can be computed by:
Water holding capacity = (M1-M2) / M2×100% (2)
Table 1. Physical-chemical indices of the soil and their measurement methods
|
Index |
Water content |
Bulk density |
pH |
Conductivity |
Organic carbon content |
Total nitrogen |
|
Method |
Gravimetric method |
Ring shear testing |
pH meter |
Conductivity meter |
External heating of potassium dichromate |
Kjeldahl method |
|
Index |
Total phosphorus |
Available nitrogen content |
Available phosphorus content |
Available potassium content |
Cation exchange capacity |
Biomass carbon, and microbial biomass nitrogen of soil microbes |
|
Method |
Perchloric acid-molybdenum-antimony anti-colorimetric method |
Alkali diffusion method |
Sodium bicarbonate extraction-molybdenum-antimony anti-colorimetric method |
Flame photometry |
Ammonium acetate exchange method |
Chloroform fumigation-K2SO4 extraction-potassium dichromate volumetric method |
Table 1 summarizes the measurement methods for other methods: The water content was measured by the gravimetric method, the bulk density by ring shear testing, and pH and electrical conductivity with pH meter and conductivity meter.
2.2 Measurement of microbial diversity
Figure 1 explains the flow of statistical analysis on soil microbes. The microbial sequencing results on soil microbes were outputted from Illumina PE250, and subject to sequence splicing and quality control. Based on the resulting valid sequence, operational taxonomic unit (OTU) clustering and diversity analysis were carried out to obtain an abundance table of arbuscular flora. Then, integrated analyses were performed on α diversity, species composition, β diversity, species difference, as well as species, functions, and physical-chemical factors.
Figure 1. Flow of statistical analysis on soil microbes
(1) Determination of fungal infection rate of crop roots
The fungal infection intensity and rate of crop roots in each soil sample were measured by the classification standards of infection and arbuscular abundance. The fungal infection rate of crop roots can be calculated by:
Ffi= (number of root segments infected by fungus / total number of root segments) × 100% (3)
The fungal infection intensity of the entire root system of the crop can be calculated by
Irsy = (N1+5N2+30N3+70N4+95N5) / total number of root segments (4)
where, N1, N2, N3, N4, and N5 are the number of root segments suffering fungal infection on levels 1-5, respectively. The fungal infection intensity of a root segment can be calculated by:
Irse= Irsy× total number of root segments / number of root segments infected by fungus (5)
Let A1, A2, and A3 be the arbuscular abundance of different grades in the root segments. Then, the arbuscular abundance of an infested root segment can be calculated by:
Arse= (10A1+50A2+100A3) / 100 (6)
The arbuscular abundance of the entire root system can be calculated by:
${{A}_{rsy}}={{A}_{rse}}\times \left( {{I}_{rsy}}/100 \right)$ (7)
(2) Determination of diversity indices
To accurately measure the microbial diversity in soil samples, it is necessary to calculate and draw the relevant evaluation indices, box plots, and dilution curves. The Chao diversity index, which estimates the total number of species and the number of OTU classes in the microbial community, can be calculated by:
${{C}_{Chao}}={{C}_{A}}+\frac{{{g}_{1}}({{g}_{1}}-1)}{2({{g}_{2}}+1)}$ (8)
where, CA is the observed number of OTU classes of the flora; g1 and g2 are the number of OTU classes containing only one and two sequences, respectively. Let Ni be the number of sequences contained in the i-th OTU class, and NT be the total number of sequences. Then, the Shannon-Weiner diversity index, which reflecting the diversity of the community, can be calculated by:
$D{{L}_{Shannon}}=\sum\limits_{i=1}^{{{C}_{A}}}{\frac{{{N}_{i}}}{{{N}_{T}}}\ln }\frac{{{N}_{i}}}{{{N}_{T}}}$ (9)
The Simpson’s diversity index, which quantifies the microbial diversity in a region, can be calculated by:
$AD{{L}_{Simpson}}=\frac{\sum\limits_{i=1}^{{{C}_{A}}}{{{N}_{i}}({{N}_{i}}-1)}}{{{N}_{T}}({{N}_{T}}-1)}$ (10)
The Shannon- Weiner diversity index and Simpson’s diversity index are negatively correlated with the microbial diversity in soil samples. The Coverage index, which reflects whether the sequencing results are in line with the actual situation of the soil samples, can be calculated by:
${{R}_{Coverage}}=1-\frac{{{N}_{i}}}{{{N}_{T}}}$ (11)
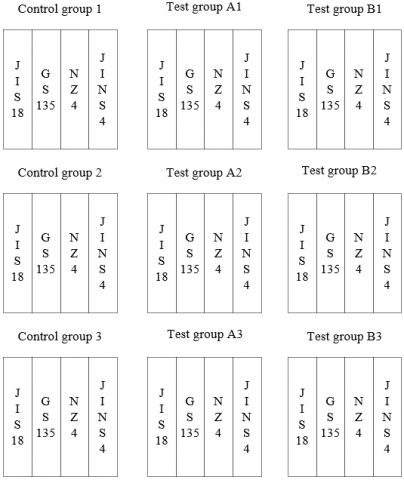
Figure 2. Test area arrangement
The test fertilizers mainly include organic biomass amendments (including organic fermentation products, biochar, microbial strains, and water retention agents), substrates (including organic fermentation products, and water retention agents), and compound fertilizers (including nitrogen, phosphorus, potassium, and other essential elements for plant growth). The test crops were sweet potatoes of the varieties Jishu 18, Guangshu 135, Ningzi 4, and Jingshu 6. For clarity, the four varieties are coded as JIS18, GS135, NZ4, and JINS6 in turn.
Our tests were carried out in a flat and neatly-shaped area. A total of nine 10m×10m plots were set up, namely, Control Groups 1-3 (adding compound fertilizers), Test Groups A1-3 (adding compound fertilizers and substrates), and Test Groups B1-3(adding compound fertilizers and organic biomass amendments). In each type of groups, 1-3 indicate the dosage of materials. The four varieties of sweet potatoes were sown separately in the test area. The arrangement is described in Figure 2.
Table 2 presents the physical-chemical performance of soil samples from Huangyangtan sandy land. The soil samples were collected from each plot following the application of organic biomass amendments. After sowing, samples were collected again in rooting and slow seedling stage, branching and tuberization stage, full leaf stage, and tuber expansion stage, respectively. Some of the samples were stored in fridge for measuring microbial diversity, and the others were passed through soil sieves with different aperture sizes for measuring physical-chemical indices.
4.1 Influence of different fertilizes on physical performance of soil
Table 3 presents the bulk density and water holding capacity of soil in each group. The samples in Test Groups B had lower bulk density than those in Test Groups A, mainly because of the biochar in the organic biomass amendment; the microbial agent also exerted an effect, but not very obvious. Compared with the Control Groups, the fertilizers in Test Groups A and B increased the water holding capacity of soil; Test Groups B, which added biochar and microbial agent, achieved the most prominent promoting effect on water holding capacity, a sign of high sustainability.
4.2 Influence of different fertilizes on chemical performance of soil
Table 2. Physical-chemical performance of soil samples from Huangyangtan sandy land
|
Depth/cm |
N/mg·kg-1 |
P/mg·kg-1 |
K/mg·kg-1 |
Organic matter/g·kg-1 |
pH |
|
0-5 |
25.9 |
5.74 |
98.4 |
3.32 |
8.20 |
|
5-10 |
24.9 |
5.69 |
94.6 |
3.34 |
8.19 |
|
10-15 |
23.7 |
5.52 |
91.2 |
3.37 |
8.21 |
|
15-20 |
22.0 |
5.31 |
88.2 |
3.36 |
8.20 |
Table 3. Bulk density and water holding capacity of soil in each group
|
Group |
Bulk density/g·cm-3 |
Water holding capacity/% |
|
Control Group 1 |
1.51±0.025c |
11.1±0.42b |
|
Control Group 2 |
1.55±0.061c |
12.4±0.53c |
|
Control Group 3 |
1.52±0.047b |
11.7±0.85a |
|
Test Group A1 |
1.56±0.012a |
14.6±0.21d |
|
Test Group A2 |
1.57±0.064a |
15.3±0.34c |
|
Test Group A3 |
1.56±0.081d |
15.6±0.48a |
|
Test Group B1 |
1.55±0.042d |
17.3±0.19c |
|
Test Group B2 |
1.55±0.073c |
17.5±0.12b |
|
Test Group B3 |
1.54±0.037a |
18.1±0.11c |
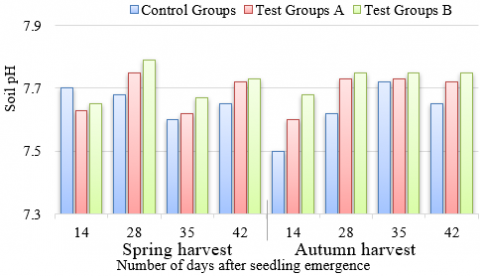
The first task is to measure and compare the pH values of soil samples. Figure 3 reveals the overall trend of pH: a year-on-year slow decrease. It can be inferred from Figure 3 that the pH of soil samples from spring harvest periods slightly increased in Test Groups A and B, with the application of biomass amendment, but did not change significantly as compared to Control Groups. The soil samples from autumn harvest periods all saw a decline in pH.
Figure 3. Influence of biomass amendment on soil pH in Huangyangtan sandy land
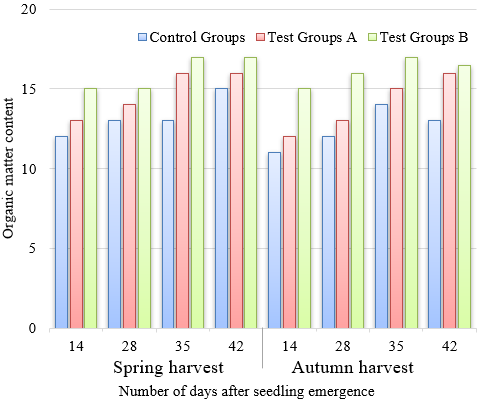
Table 4 shows the organic matter content of each group, which characterizes the biological structure and properties of the corresponding soil sample. Comparing the organic matter contents between two depths (0-10 and 10-20) and the four growth stages, except the Control Groups, all Test Groups had a clear increase in organic matter content. The increment was between 6%-11% in the soil at the depth of 0-10cm, and between 4-8% in the soil at the depth of 10-20cm. Test Group B2 achieved the largest rise in organic matter content, a signal of sustainability. Compared with the soil of 10-20cm, the soil of 0-10cm had an abundance of organic matter, but without any clear distribution pattern or transition law. Figure 4 provides the influence of biomass amendment on the organic matter content of soil samples from Huangyangtan sandy land.
Table 5 lists the content of soil alkali hydrolysable nitrogen that can be directly absorbed by crops in each group. Through the four growth stages, the content of alkali hydrolysable nitrogen in the soil of each test group was higher than that of Control Groups. During the tuber expansion stage, Test Groups A achieved 6%-9% higher nitrogen content than Test Groups B. Test Group B2 realized the most prominent growth in the content of soil alkali hydrolysable nitrogen, an evidence of sustainability. Test Groups A, which apply substrates and conventional compound fertilizer, did not achieve a high nitrogen content. This is mainly because the organic biomass amendment is rich in high-quality microbial agents, which effectively increase the nitrogen content in the soil.
Figure 4. Influence of biomass amendment on soil pH in Huangyangtan sandy land
Table 4. Organic matter content of soil samples in different groups
|
Soil depth/cm |
Growth stage |
Groups |
|||||
|
Test Group A1 |
Test Group A2 |
Test Group A3 |
Test Group B1 |
Test Group B2 |
Test Group B3 |
||
|
0-10 |
Rooting and slow seedling stage |
3.21±0.33b |
3.56±0.24a |
3.15±0.34b |
3.77±0.79a |
3.76±0.45a |
3.84±0.15a |
|
Branching and tuberization stage |
3.47±0.15c |
3.87±0.52b |
3.33±0.27c |
4.01±0.11a |
3.96±0.31b |
4.64±0.23b |
|
|
Full leaf stage |
3.49±0.25c |
4.02±0.36b |
3.36±0.06c |
4.46±0.64a |
4.18±0.23b |
4.91±0.11b |
|
|
Tuber expansion stage |
3.62±0.16b |
4.09±0.44a |
3.48±0.48b |
4.24±0.83a |
3.54±0.71ab |
4.87±0.37ab |
|
|
10-20 |
Rooting and slow seedling stage |
3.13±0.41b |
3.51±0.19a |
3.22±0.17b |
3.55±0.97a |
4.18±0.62a |
3.41±0.11a |
|
Branching and tuberization stage |
3.36±0.18b |
3.46±0.08a |
3.37±0.02b |
3.65±0.18a |
4.16±0.22a |
3.48±0.14a |
|
|
Full leaf stage |
3.39±0.15b |
3.61±0.11a |
3.19±0.23b |
3.79±0.63a |
4.29±0.37a |
3.51±0.18a |
|
|
Tuber expansion stage |
3.47±0.03b |
3.53±0.23a |
3.33±0.16b |
3.63±0.19a |
4.14±0.32a |
3.59±0.17a |
|
Table 5. Nitrogen content of each group
|
Soil depth/cm |
Growth stage |
Groups |
|||||
|
Test Group A1 |
Test Group A2 |
Test Group A3 |
Test Group B1 |
Test Group B2 |
Test Group B3 |
||
|
0-10 |
Rooting and slow seedling stage |
46.3±2.01a |
31.1±0.87c |
28.4±1.54d |
52.5±2.13c |
56.4±1.47b |
55.3±1.31b |
|
Branching and tuberization stage |
51.0±4.7a |
33.5±2.41b |
29.4±3.23c |
52.4±1.81b |
57.1±1.32b |
55.1±2.47b |
|
|
Full leaf stage |
45.3±2.36a |
38.7±1.88c |
27.5±2.69d |
55.4±2.66b |
51.0±2.65b |
56.1±3.63c |
|
|
Tuber expansion stage |
42.4±0.87a |
37.6±0.49b |
29.1±1.69d |
53.4±0.69a |
52.7±1.57ab |
56.9±1.74c |
|
|
10-20 |
Rooting and slow seedling stage |
32.2±1.24a |
25.2±1.23b |
26.1±1.31c |
45.9±0.47b |
48.6±2.17a |
47.4±0.58b |
|
Branching and tuberization stage |
28.8±2.92a |
27.5±0.99a |
24.7±0.86b |
46.0±1.72a |
48.9±1.69a |
48.1±1.27a |
|
|
Full leaf stage |
28.6±1.46a |
27.7±1.71a |
21.3±1.56b |
47.3±1.37a |
49.1±0.74a |
47.7±1.16a |
|
|
Tuber expansion stage |
29.9±0.13b |
28.1±0.64c |
22.6±1.45c |
48.7±0.22a |
49.5±0.38ab |
49.1±1.93c |
|
Table 6. Phosphorus content of each group
|
Soil depth/cm |
Growth stage |
Groups |
|||||
|
Test Group A1 |
Test Group A2 |
Test Group A3 |
Test Group B1 |
Test Group B2 |
Test Group B3 |
||
|
0-10 |
Rooting and slow seedling stage |
7.45±0.24b |
7.65±0.61b |
8.02±0.73b |
8.46±0.11d |
9.35±0.16a |
9.35±0.42c |
|
Branching and tuberization stage |
8.23±0.84b |
8.47±0.79b |
8.45±0.55b |
8.84±0.15d |
10.20±0.67a |
9.68±0.24c |
|
|
Full leaf stage |
9.41±0.76a |
9.19±0.24a |
9.16±0.47b |
8.93±0.27c |
8.17±0.48b |
9.04±0.54a |
|
|
Tuber expansion stage |
9.56±0.66a |
9.66±0.72a |
9.67±0.12a |
8.97±0.45c |
8.35±0.77b |
9.18±0.64a |
|
|
10-20 |
Rooting and slow seedling stage |
6.41±0.23b |
6.46±0.41b |
6.64±0.13b |
7.48±0.17d |
8.54±0.38a |
7.21±0.22c |
|
Branching and tuberization stage |
6.57±0.49c |
6.96±0.22bc |
6.87±0.47b |
7.64±0.53e |
8.42±0.44a |
7.35±0.33d |
|
|
Full leaf stage |
6.85±0.25c |
6.99±0.31bc |
7.27±0.54b |
7.55±0.37d |
7.37±0.59a |
7.48±0.42c |
|
|
Tuber expansion stage |
7.14±0.65a |
7.32±0.04a |
7.59±0.16b |
7.54±0.16b |
7.12±0.66a |
7.04±0.15a |
|
Table 6 shows the group difference in soil phosphorus content, an important limiting factor of plant productivity. It can be seen that the effective phosphorus content in each test group was higher in the four growth stages compared to that in Control Groups. During the tuber expansion stage, Test Groups A and B surpassed Control Groups by 21% -45% in effective phosphorus content; the 10-20cm soil layer had a slightly lower effective phosphorus content than the 0-10cm soil layer. Test Group B2 achieved the most significant effect on improving the effective phosphorus content, a sign of sustainability. The improving effect of Test Groups A was not as strong as that of Test Groups B. The main contributor to the effect is biochar, while microbial agent did not play an important role.
Table 7 shows the group difference in soil potassium content, a key determinant of the chemical quality of the soil. Compared with Control Groups, all test groups had relatively high effective potassium content in all four growth stages. During tuber expansion stage, Test Groups A and B achieved an 18%-33% higher potassium content than Control Groups. In both soil depths, Test Group B3 boasted the best effect, suggesting the sustainability of its treatment.
Table 7. Potassium content of each group
|
Soil depth/cm |
Growth stage |
Groups |
|||||
|
Test Group A1 |
Test Group A2 |
Test Group A3 |
Test Group B1 |
Test Group B2 |
Test Group B3 |
||
|
0-10 |
Rooting and slow seedling stage |
111±5.41c |
115±4.57b |
95±4.16d |
121±7.01a |
133.71b |
151±3.77b |
|
Branching and tuberization stage |
121±4.17b |
127±5.64b |
94±3.96c |
154±4.43a |
142±6.28b |
173±5.17b |
|
|
Full leaf stage |
137±2.23b |
142±2.53a |
98±2.28c |
111±6.72b |
148±3.39b |
179±4.42b |
|
|
Tuber expansion stage |
141±6.67a |
157±7.31a |
99±3.54c |
158±6.16b |
154±5.53a |
187±4.69a |
|
|
10-20 |
Rooting and slow seedling stage |
94±3.41bc |
94±2.71b |
91±4.35c |
15±4.87a |
96±5.92bc |
96±3.28b |
|
Branching and tuberization stage |
94±5.35bc |
111±3.78b |
96±5.98c |
123±2.96a |
99±3.41bc |
115±4.32b |
|
|
Full leaf stage |
91±4.16a |
126±6.42a |
89±3.47b |
143±7.26a |
106±4.25a |
123±5.07a |
|
|
Tuber expansion stage |
111±3.71a |
186±5.15a |
89±2.51c |
129±3.41b |
109±7.44a |
123±4.17a |
|
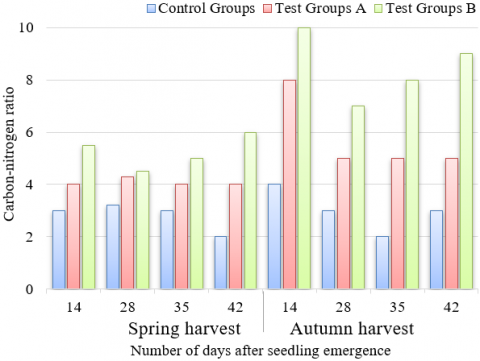
Figure 5 displays the influence of biomass amendment on nitrogen, phosphorous, and potassium contents in Huangyangtan sandy land. With the growing application of compound fertilizer, substrate, and organic biomass amendment, the nitrogen, phosphorous, and potassium contents in every group first increased and then decreased. The reason is that the treatments in all groups contain compound fertilizer. By contrast, the nitrogen, phosphorous, and potassium contents increased linearly in the soil samples applied with substrate and those applied with biomass amendment alone; the latter samples achieved more significant increase. Hence, biochar and microbial agent are more suitable for improving sandy soil, and stronger in fertilizer effect, creating a value of sustainable utilization. Figure 6 illustrates the influence of biomass amendment on the carbon-nitrogen ratio in Huangyangtan sandy land.
(a) Nitrogen content
(b) Phosphorous content
(c) Potassium content
Figure 5. Influence of biomass amendment on nitrogen, phosphorous, and potassium contents in Huangyangtan sandy land
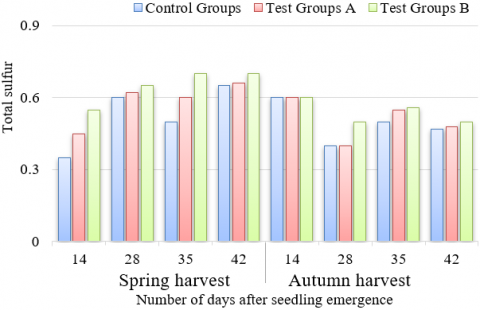
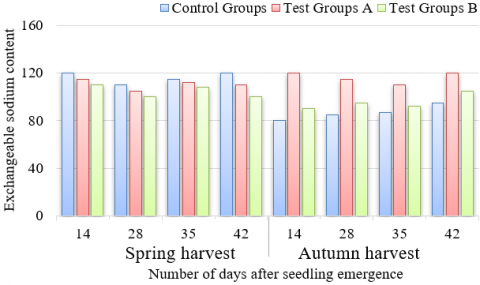
Figure 7 presents the influence of biomass amendment on the total sulfur and exchangeable sodium content in Huangyangtan sandy land. During spring harvest or autumn harvest, the groups did not differ greatly in total sulfur in the soil. During the seedling period, the soil samples from the autumn harvest periods had slightly lower total sulfur than those from the spring harvest periods. During the tuber expansion stage of autumn harvest crops, Test Groups A and B were much higher than Control Groups in exchangeable sodium content. With the higher exchangeable sodium content, Test Groups A’s treatment has a certain value of sustainable use.
Figure 6. Influence of biomass amendment on the carbon-nitrogen ratio in Huangyangtan sandy land
(a) Total sulfur
(b) Exchangeable sodium content
Figure 7. Influence of biomass amendment on the total sulfur and exchangeable sodium content in Huangyangtan sandy land
4.3 Influence of fertilizers on biological performance of soil
Figure 8. Influence of biomass amendment on the amount of bacteria in Huangyangtan sandy land
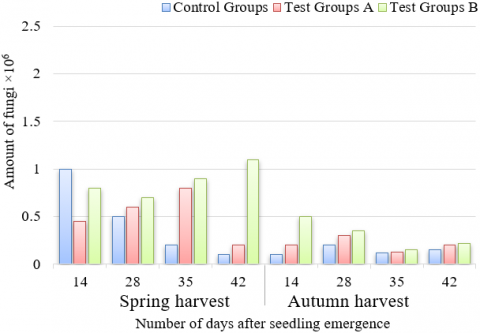
After optimizing the original sequencing, clustering analysis was performed on the flora formed through OTU classification, followed by biological diversity analysis. Table 8 provides the diversity index values and number of OTU classes. Judging by Shannon-Weiner index, Test Group B1 had the highest microbial diversity, followed by Test Group B3; the same trend was observed from the Simpson’s index. From Coverage values, it was learned that the data coverage was high (>0.99) in every group. Figure 8 shows the influence of biomass amendment on the amount of bacteria in Huangyangtan sandy land. It can be seen that, whether the soil samples were collected from spring or autumn harvest period, the amount of bacteria in the samples increased significantly with the addition of organic biomass amendment. As shown in Figure 9, the organic biomass amendment had similar influences on the amount of fungi and microbial biomass carbon in Huangyangtan sandy land.
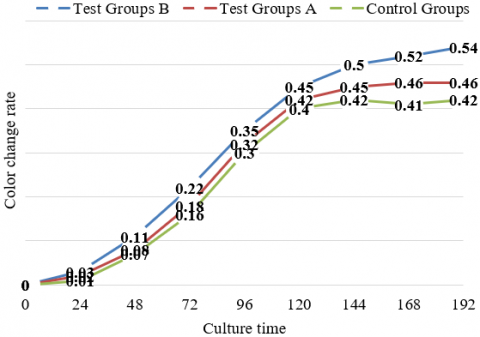
Color change rate is a key indicator of microbial activity in soil. The higher the color change rate, the more active the microbes in soil. Figure 10 provides the color change rate of microbial community in soil samples during spring harvest and autumn harvest. During spring and autumn harvests, the color change rate of Test Groups A and B increased greater than the Control Groups, with the elapse of time. The highest rate was observed in Test Groups B, which adds both biochar and microbial agent. Hence, organic biomass agent can effectively improve the microorganism activity in sandy soil.
Table 8. Microbial diversity indices of soil samples
|
Group |
Number of sequences |
Diversity index |
||||
|
Shannon-Weiner |
Coverage |
Chao |
Simpson |
OTU |
||
|
Test Group A1 |
54238 |
0.0547 |
0.991 |
487 |
3.25 |
413 |
|
Test Group A2 |
52695 |
0.0543 |
0.995 |
495 |
3.17 |
453 |
|
Test Group A3 |
51886 |
0.0495 |
0.994 |
484 |
3.85 |
442 |
|
Test Group B1 |
55297 |
0.1326 |
0.997 |
398 |
4.14 |
397 |
|
Test Group B2 |
56864 |
0.0639 |
0.997 |
424 |
3.22 |
364 |
|
Test Group B3 |
49867 |
0.0897 |
0.999 |
542 |
4.06 |
448 |
(a) Amount of fungi
(b) Microbial biomass carbon
Figure 9. Influence of biomass amendment on the amount of fungi and microbial biomass carbon in Huangyangtan sandy land
(a) Spring harvest
(b) Autumn harvest
Figure 10. Color change rate of microbial community in soil samples during spring harvest and autumn harvest
4.4 Influence of fertilizers on crop yield
The yield and yield indices of sweet potatoes change to varied degrees after the application of different fertilizers. Table 9 summarizes the yield of different groups. The sweet potato yield was significantly enhanced by any of the three fertilizers: compound fertilizer, substrate, and organic biomass amendment. The most prominent enhancement was achieved by organic biomass amendment, about 1,229-2,071 kg·hm-2 more than that of the Control Groups, followed by substrate, and compound fertilizer (the enhancement by the latter was 502-782 kg·hm-2 greater than that by the former). The plots treated with different fertilizers also differed in leaf length, number of leaves, number of tubers, and single tuber weight. Their impacts on these indies were similar as those on yield. This means biochar and microbial agent can indeed promote crop yield and create the value of sustainable utilization.
Table 9. Yield of different groups
|
Group |
Yield index |
Yield/kg·hm-2 |
|||
|
Leaf length/cm |
Number of leaves |
Number of tubers |
Single tuber weight/g |
||
|
Test Group A1 |
5.8±1.27a |
9.9±3.68a |
5.41±2.38b |
153.16±0.19b |
6547±411.68c |
|
Test Group A2 |
5.2±0.48a |
10.8±3.11a |
4.47±9.12ab |
164.61±0.43ab |
6694±296.09ab |
|
Test Group A3 |
5.8±1.56a |
13.9±3.22a |
5.56±2.57a |
175.11±1.60a |
6218±375.48a |
|
Test Group B1 |
6.3±0.77a |
14.4±2.12a |
6.47±4.31ab |
151.92±1.31b |
7154±132.01b |
|
Test Group B2 |
6.1±1.42a |
13.7±4.81a |
7.63±2.25b |
153.86±1.16ab |
7783±213.93b |
|
Test Group B3 |
6.8±1.58a |
16.0±1.84a |
6.52±4.14a |
144.71±1.27ab |
7396±175.72ab |
This paper chooses the grasslands with different degrees of desertification in Huangyangtan, the largest sandy land in northern China’s Hebei Province, as the object, and explores the remediation effect of biomass amendment on the physical-chemical performance and sustainable utilization of sandy soil. Firstly, the authors detailed the strategies to measure the physical-chemical indices, determine fungal infection rate of crop roots, and evaluate microbial diversity of Huangyangtan sandy soil. Next, a complete test design was made for the biomass amendment on Huangyangtan sandy soil, including the materials and test procedure. After that, the test results were analyzed in details to reveal the influence of different test fertilizers on the soil in terms of physical performance, chemical performance, biological performance, and crop yield. The analysis verifies that biomass amendment can promote the amelioration of sandy soil, optimize its physical-chemical performance, and increase the beneficial bacteria, thereby promoting the sustainable use of the sandy land.
This paper was supported by Observation and Research Station of for Sandy Land Ecosystem in Fengning, Hebei, National Forestry and Grassland Administration (No.: 2020132020).
[1] Kang, C.U., Kim, D.H., Khan, M.A., Kumar, R., Ji, S.E., Choi, K.W., Jeon, B.H. (2020). Pyrolytic remediation of crude oil-contaminated soil. Science of the Total Environment, 713: 136498. https://doi.org/10.1016/j.scitotenv.2020.136498
[2] Barbosa Ferreira, M., Sales Solano, A.M., Vieira dos Santos, E., Martínez-Huitle, C.A., Ganiyu, S.O. (2020). Coupling of anodic oxidation and soil remediation processes: A review. Materials, 13(19): 4309. https://doi.org/10.3390/ma13194309
[3] Hamid, Y., Tang, L., Hussain, B., Usman, M., Lin, Q., Rashid, M.S., Yang, X. (2020). Organic soil additives for the remediation of cadmium contaminated soils and their impact on the soil-plant system: A review. Science of The Total Environment, 707: 136121. https://doi.org/10.1016/j.scitotenv.2019.136121
[4] Ren, J., Song, X., Ding, D. (2020). Sustainable remediation of diesel-contaminated soil by low temperature thermal treatment: Improved energy efficiency and soil reusability. Chemosphere, 241: 124952. https://doi.org/10.1016/j.chemosphere.2019.124952
[5] Grassi, C., Cecchi, S., Baldi, A., Zanchi, C.A., Orlandini, S., Pardini, A., Napoli, M. (2020). Crop suitability assessment in remediation of Zn contaminated soil. Chemosphere, 246: 125706. https://doi.org/10.1016/j.chemosphere.2019.125706
[6] Pei, G., Zhu, Y., Wen, J., Pei, Y., Li, H. (2020). Vinegar residue supported nanoscale zero-valent iron: Remediation of hexavalent chromium in soil. Environmental Pollution, 256: 113407. https://doi.org/10.1016/j.envpol.2019.113407
[7] Ogunmokun, F.A., Liu, Z., Wallach, R. (2020). The influence of surfactant-application method on the effectiveness of water-repellent soil remediation. Geoderma, 362: 114081. https://doi.org/10.1016/j.geoderma.2019.114081
[8] Paltseva, A.A., Cheng, Z., Egendorf, S.P., Groffman, P.M. (2020). Remediation of an urban garden with elevated levels of soil contamination. Science of the Total Environment, 722: 137965. https://doi.org/10.1016/j.scitotenv.2020.137965
[9] Krouzek, J., Durdak, V., Hendrych, J., Masin, P., Sobek, J., Spacek, P. (2018). Pilot scale applications of microwave heating for soil remediation. Chemical Engineering and Processing-Process Intensification, 130: 53-60. https://doi.org/10.1016/j.cep.2018.05.010
[10] Centofanti, T., Chaney, R.L., Beyer, W.N., McConnell, L.L., Davis, A.P., Jackson, D. (2016). Assessment of trace element accumulation by earthworms in an orchard soil remediation study using soil amendments. Water, Air, & Soil Pollution, 227(9): 1-14. https://doi.org/10.1007/s11270-016-3055-0
[11] Kim, S.S., Han, G.S., Kim, G.N., Koo, D.S., Kim, I.G., Choi, J.W. (2016). Advanced remediation of uranium-contaminated soil. Journal of Environmental Radioactivity, 164: 239-244. https://doi.org/10.1016/j.jenvrad.2016.08.005
[12] Rede, D., Santos, L.H., Ramos, S., Oliva-Teles, F., Antão, C., Sousa, S.R., Delerue-Matos, C. (2016). Ecotoxicological impact of two soil remediation treatments in Lactuca sativa seeds. Chemosphere, 159: 193-198. https://doi.org/10.1016/j.chemosphere.2016.06.002
[13] Rocco, M.V., Cassetti, G., Gardumi, F., Colombo, E. (2016). Exergy Life Cycle Assessment of soil erosion remediation technologies: an Italian case study. Journal of Cleaner Production, 112: 3007-3017. https://doi.org/10.1016/j.jclepro.2015.10.055
[14] McWatters, R.S., Wilkins, D., Spedding, T., Hince, G., Raymond, B., Lagerewskij, G., Snape, I. (2016). On site remediation of a fuel spill and soil reuse in Antarctica. Science of the Total Environment, 571: 963-973. https://doi.org/10.1016/j.scitotenv.2016.07.084
[15] Soltaninejad, H., Lotfabad, T.B., Yaghmaei, S. (2016). Enhanced Soil Remediation via Plant-Based Surfactant Compounds from Acanthophyllum Laxiusculum. Tenside Surfactants Detergents, 53(4): 324-331. https://doi.org/10.3139/113.110453
[16] Vidonish, J.E., Alvarez, P.J., Zygourakis, K. (2018). Pyrolytic remediation of oil-contaminated soils: reaction mechanisms, soil changes, and implications for treated soil fertility. Industrial & Engineering Chemistry Research, 57(10): 3489-3500. https://doi.org/10.1021/acs.iecr.7b04651
[17] Skibsted, G., Ottosen, L.M., Elektorowicz, M., Jensen, P.E. (2018). Effect of long-term electrodialytic soil remediation on Pb removal and soil weathering. Journal of Hazardous Materials, 358: 459-466. https://doi.org/10.1016/j.jhazmat.2018.05.033
[18] Wei, X., Guo, S., Wu, B., Li, F., Li, G. (2016). Effects of reducing agent and approaching anodes on chromium removal in electrokinetic soil remediation. Frontiers of Environmental Science & Engineering, 10(2): 253-261. https://doi.org/10.1007/s11783-015-0791-0
[19] Kang, G., Park, K., Cho, J., Stevens, D.K., Chung, N. (2015). Remediation of polycyclic aromatic hydrocarbons in soil using hemoglobin-catalytic mechanism. Journal of Environmental Engineering, 141(10): 04015025. https://doi.org/10.1061/(ASCE)EE.1943-7870.0000955
[20] Dias-Ferreira, C., Kirkelund, G.M., Ottosen, L.M. (2015). Ammonium citrate as enhancement for electrodialytic soil remediation and investigation of soil solution during the process. Chemosphere, 119: 889-895. https://doi.org/10.1016/j.chemosphere.2014.08.064
[21] Balawejder, M., Józefczyk, R., Antos, P., Pieniążek, M. (2016). Pilot-scale Installation for Remediation of DDT-contaminated Soil. Ozone: Science & Engineering, 38(4): 272-278. https://doi.org/10.1080/01919512.2015.1136556
[22] Soobhany, N. (2018). Remediation potential of metalliferous soil by using extracts of composts and vermicomposts from Municipal Solid Waste. Process Safety and Environmental Protection, 118: 285-295. https://doi.org/10.1016/j.psep.2018.07.005
[23] Obrycki, J.F., Basta, N.T., Scheckel, K., Stevens, B.N., Minca, K.K. (2016). Phosphorus amendment efficacy for in situ remediation of soil lead depends on the bioaccessible method. Journal of Environmental Quality, 45(1): 37-44. https://doi.org/10.2134/jeq2015.05.0244
[24] Park, S., Sung, K. (2020). Leaching Potential of Multi-metal-Contaminated Soil in Chelate-Aided Remediation. Water, Air, & Soil Pollution, 231(2): 1-10. https://doi.org/10.1007/s11270-020-4412-6
[25] Lominchar, M.A., Santos, A., De Miguel, E., Romero, A. (2018). Remediation of aged diesel contaminated soil by alkaline activated persulfate. Science of the Total Environment, 622: 41-48. https://doi.org/10.1016/j.scitotenv.2017.11.263
[26] Mekwichai, P., Tongcumpou, C., Kittipongvises, S., Tuntiwiwattanapun, N. (2020). Simultaneous biosurfactant-assisted remediation and corn cultivation on cadmium-contaminated soil. Ecotoxicology and Environmental Safety, 192: 110298. https://doi.org/10.1016/j.ecoenv.2020.110298