Fei Zhang | Kui Wang* | Yaru Dang | Guoyin Wu
© 2020 IIETA. This article is published by IIETA and is licensed under the CC BY 4.0 license (http://creativecommons.org/licenses/by/4.0/).
OPEN ACCESS
The macro mechanical properties of soil-rock mixture are closely related to the meso-structure features of block stones, namely, content, size, and shape. To promote the engineering application of soil-rock mixture, it is important to explore the meso-structure of the mixture, and evaluate its constitutive properties. The previous studies have shown that the wave propagation in the mixture is highly sensitive to the rock content and compaction. To clarify the meso-structure features of soil-rock mixture, this paper establishes a discrete element model of the mixture based on Particle Flow Code (PFC), investigates the wave propagation features in the model with different meso-structure parameters, and analyzes how the meso-structure parameters affect the wave propagation. The results show that: With the growing rock content, the first wave amplitude increased, while the take-off time shortened; With the growing feature size of block stone, the first wave amplitude gradually decreased, while the take-off time gradually lengthened; The soil-rock mixture containing spherical block stones had the highest first wave amplitude and shortest take-off time, while the mixture containing rectangular block stones had the lowest first wave amplitude and longest take-off time. With the growing rock content, the maximum amplitude, dominant frequency, and spectral area all exhibited an increasing trend; With the growing feature size of block stone, the maximum amplitude, dominant frequency, and spectral area all exhibited a decreasing trend.
soil-rock mixture, particle flow code (PFC), meso-structure features, wave parameters
The soil-rock mixture is a complex geological medium. Its physical-mechanical properties hinge on the nature and internal structure of the soil and rock particles. Due to its complex and nonlinear structure, the soil-rock mixture exhibits uncertain and irregular mechanical behaviors. Therefore, the meso-structure features of soil-rock mixture have attracted much attention in the academia.
At present, the meso-structure of soil-rock mixture is mostly investigated by setting up random models of its features on various modeling software, after field measurement, image processing, and laser scanning. For example, Jin et al. [1] proposed the three-dimensional (3D) composite wall method, and realized the 3D discrete element simulation of the flexible membrane boundary. Medley and Lindquist [2] introduced the rock content measurement method in engineering to ascertain the rock content and distribution in soil-rock mixture. Li et al. [3] statistically analyzed the structural features of soil-rock mixture through field survey, and simulated the distribution of block stones in the mixture by the Monte-Carlo principle. Through regression analysis and inverse Fourier transform, Yu et al. [4] set the various parameters of block stones and randomly placed them in soil-rock mixture, using the block stone intersection determination algorithm. With the aid of laser scanning, Lanaro and Tolppanen [5] analyzed the 3D structure of soil-rock mixture, and derived the stone shape, particle size, and particle roughness within the mixture. Lafbnd et al. [6] performed computed tomography (CT) scan on soil-rock mixture, and evaluated the relationship between the state, distribution, and flow pattern of pores within the mixture. With the help of radar detection, Sass and Krautblatter [7] identified the size and composition of the block stone particles in soil-rock mixture.
As a simple, fast, reliable, and nondestructive technique, wave detection has a promising prospect in the research on the internal structure of soil-rock mixture, because the wave features of soil-rock mixture depend directly on its structural features. Considering the particularity of the meso-structure of soil-rock mixture, it is necessary to clarify the relationship between the meso-structure features of the mixture and the wave propagation features, laying the basis for meso-structure analysis on the mixture.
Since the 1950s, many scholars have explored the body wave theory of saturated soil-rock mixture. Biot [8] theorized the fluid wave in porous saturated materials, which is widely recognized in the academia. Ghorai et al. [9] discussed the propagation features of the Love wave on a layer of saturated porous medium with a rigid boundary and above an elastic half-space. Chen et al. [10] derived the characteristic equations of Rayleigh wave and Love wave in unsaturated porous media. The soil-rock mixture is a multiphase composite medium, including solid phase, liquid phase, and gas phase. Because of the extremely heterogeneous structure, the soil-rock ratio, compaction, stone type, stone shape, and particle size may have a significant impact on wave propagation within the mixture [11].
To sum up, the following issues must be clarified to evaluate the internal structure of soil-rock mixture with wave detection: clarifying the wave propagation features in the mixture based on meso-structure analysis, setting up the correspondence between the meso-structure features of the mixture and wave responses, and characterizing the wave parameters that fully reflect the meso-structure features of the mixture. Therefore, this paper constructs a two-dimensional (2D) discrete element model of soil-rock mixture based on Particle Flow Code (PFC), and evaluates the influence of different meso-structure parameters on wave propagation in the mixture.
The meso-structure of soil-rock mixture is very complex. Different particles in the mixture vary greatly in size and physical properties. The meso-structure is highly heterogenous, discontinuous, and non-uniform [12]. Four meso-structure parameters of the mixture were selected for quantitative analysis: rock content, feature size of block stone, and size of block stone.
2.1 Rock content
In soil-rock mixture, the size of block stones is independent of any other factors [13]. The rock content n can be calculated based on the total area Ai occupied by block stones, and the total area A occupied by the model:
$\begin{equation}
n=\frac{\sum_{i=1}^{n} A_{i}}{A}
\end{equation}$ (1)
2.2 Feature size of block stone
To investigate the features of block stones in the mixture, it is necessary to limit their size in a certain range. In this paper, the size range of block stones is set to dmax= 0.75Lc [14].
2.3 Shape of block stone
The shape of block stone affects the interaction between stones, and that between stone and surrounding soil particles, which in turn influence the mechanical properties of the mixture on the meso scale. In general, the appearance of block stone is described by three metrics, namely, the size of particle layer, edge angle, and roughness [15, 16].
2.4 Size distribution
The size distribution of soil-rock mixture can be derived from the densities of block stones and the soil:
$\begin{equation}
P_{r}=\frac{R_{r}}{R \rho_{R}+S \rho_{S}} \times 100 \%
\end{equation}$ (2)
where, r is the diameter of block stone; Rr is the area of block stones with inner diameter smaller than r; R is the area of block stones; Pr is the mass percentage of block stones; S is the area of soil.
By formula (2), the size distribution curve of block stone particles was obtained, and used to deduce the fractal dimension of the size of these particles.
3.1 PFC model
According to the previous tests on the mechanical properties of the soil-rock mixture [17], the meso-structure parameters of the soil and block stones in the mixture were determined (Table 1).
Table 1. The material parameters of the discrete element model
|
Block stone parameters |
Parallel bond effective modulus/Pa |
Parallel bond stiffness ratio |
Linear contact effective modulus /Pa |
Linear contact stiffness ratio |
Parallel bond tangential cohesive strength/Pa |
Parallel bond normal cohesive strength /Pa |
Friction coefficient |
Particle density/cm |
|
Value |
30e9 |
2.5 |
29e9 |
2.5 |
1e8 |
1.2e8 |
0.5 |
2,500 |
|
Soil parameters |
Contact bond effective modulus /Pa |
Contact bond stiffness ratio |
Contact bond tensile strength /Pa |
Contact bond shear strength /Pa |
Tangential critical damping ratio |
Normal critical damping ratio |
Friction coefficient |
Particle density/cm |
|
Value |
2e8 |
2.5 |
3e5 |
1e5 |
0.2 |
0.4 |
0.4 |
1,800 |
3.1.1 Models with different rock contents
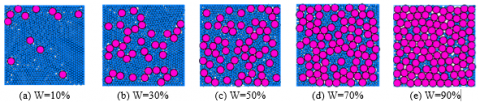
First, a 6,000*6,000 square wall boundary was set up. Then, different groups (soil and block stone) of spherical particles were generated by ball distribute. The spheres of block stones were differentiated from the soil spheres by the rock-soil threshold. For the models with different rock contents, the size of soil particles was always set to 200mm, the feature size of block stone to 600mm, and the spatial distribution of block stones to obey the random distribution in (0, 1), using math.random.uniform. The material parameters were configured as per Table 1. The relevant parameters were assigned separately to soil, block stones, and particles, forming the soil-rock mixture models with different rock contents (Figure 1).
3.1.2 Models with different feature sizes of block stone
Following the above rules, the rock-soil threshold was also adopted to distinguish between block stone group and soil group. Fixing the rock content at 30%, the particle size of the block stone group was changed to 300mm, 400mm, 500mm, 600mm, and 700mm, in turn. Without adjusting any other condition, the soil-rock mixture models with different feature sizes of block stone were obtained (Figure 2).
3.1.3 Models with different shapes of block stone
As shown in Figure 3, in the soil-rock mixture models with different shapes of block stone, the soil particles are still simulated as spheres, while the block stones are simulated as rigid clusters in the shape of sphere, square, or rectangle. The spheres and rigid clusters were given different particle parameters. For the consistency of rock content and feature size of block stone, 77 block stones (rigid clusters) were generated for each of the three models.
Figure 1. The soil-rock mixture models with different rock contents
Figure 2. The soil-rock mixture models with different feature sizes of block stone
Figure 3. The soil-rock mixture models with different shapes of block stone
3.2 Wave propagation model
3.2.1 Arrangement of measuring points
Based on the above meso-structure models of soil-rock mixture, the left side was taken as the incident boundary of a sine wave, and the right side as the transmission boundary. On the right side, several measuring points were arranged at an interval of 1,500mm to receive the wave signal from the left side (Figure 4). The sine wave was loaded dynamically to each of the above models, which differ in rock content, feature size of block stone, and shape of block stone, in order to observe the waveform.
3.2.2 Vibration source
The controllable vibrator usually emits a sine/cosine wave. Theoretically, the emission effect of the source improves with the clarity of the wave conduction. In this paper, a sine wave is excited by the mechanism in Figure 5:
$\begin{equation}
F(t)=\vec{A} \cdot \sin (2 \pi \cdot f \cdot t)
\end{equation}$ (3)
where, $\begin{equation}
\vec{A}
\end{equation}$ is the maximum amplitude of the exciting force, i.e. the maximum amplitude transmitted after the vibration occurs; f is the dominant frequency of the wave load function. Here, the values of A and f are set to 100Pa and 100Hz, respectively.
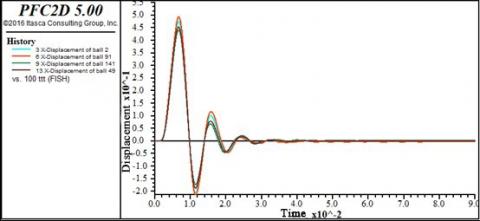
The sine wave thus excited was loaded to each model of the soil-rock mixture. As shown in Figure 6, the time-history of the vibration is as desired, indicating the rationality of the excitation mode.
3.2.3 Conditions of transmission boundary
During boundary setting, the target boundary must be able to eliminate all the energy of the incident wave. The transmission boundary can be simulated by presetting the contact force. Suppose an incident vibration wave Ut appears on the boundary. The amplitude of the wave must be doubled, so that the amplitude will not be halved after the wave energy is absorbed. Hence, the contact force between particles can be obtained as:
$\begin{equation}
F=2 R \rho C[2 \dot{U}(t)-\dot{U}]
\end{equation}$ (4)
Considering the dispersion effect, a correction factor was added to the above formula to obtain more reasonable results:
$F=\left\{ \begin{align} & -\xi \bullet 2R\rho {{C}_{p}}\overset{\bullet }{\mathop{{{U}_{n}},Normal}}\, \\ & -\eta \bullet 2R\rho {{C}_{S}}\overset{\bullet }{\mathop{{{U}_{s}}}}\,,Tangential \\\end{align} \right.$ (5)
where, ξ and η are the correction coefficients for the dispersion effect of longitudinal and transverse waves, respectively; Cp and Cs are the velocities of longitudinal and transverse waves, respectively; $\begin{equation}
\dot{U_{n}}
\end{equation}$ and $\begin{equation}
\dot{U_{s}}
\end{equation}$ are the normal and tangential velocities of particles, respectively.
Figure 4. The arrangement of measuring points
Figure 5. The excitation mechanism
Figure 6. The time-history of vibration
3.3 Simulation of wave propagation
The sine wave was loaded on the left side in each of the five models with different rock contents. The wave signal was received by the five measuring points on the right side. Then, the velocity and displacement could be directly obtained. Taking time as the abscissa and X-direction displacements of the measuring points as the ordinate, the time-histories of displacements measured at different places of soil-rock mixtures with different rock contents were plotted (Figures 7-11).
Figure 7. The time-history of displacement with rock content of 10%
Figure 8. The time-history of displacement with rock content of 30%
Figure 9. The time-history of displacement with rock content of 50%
Figure 10. The time-history of displacement with rock content of 70%
Figure 11. The time-history of displacement with rock content of 90%
From Figures 7-11, it can be seen that the entire waveform gradually declined and then tended to be stable. Comparing the five groups of waveforms, with the growing rock content, the peak gradually increased, the time to reach the peak gradually shortened, and the total vibration time continued to grow.
For the lack of space, the time-histories of displacement and velocity of the models with different feature sizes and shapes of block stone are not presented here. These time-histories were plotted similarly as Figures 7-11.
As the sine wave passes through the soil-rock mixture, the information carried by the wave is contained in the waveform curve. The information fully reflects the internal mechanical properties and structural features of the soil-rock mixture. In this chapter, the time-domain waveforms of the sine wave passing through soil-rock mixture are numerically simulated with different meso-structure parameters. Then, the useful parameter information was extracted, and used to analyze the variation of wave parameters with meso-structure features.
4.1 Time domain feature analysis
4.1.1 Influence law of rock content
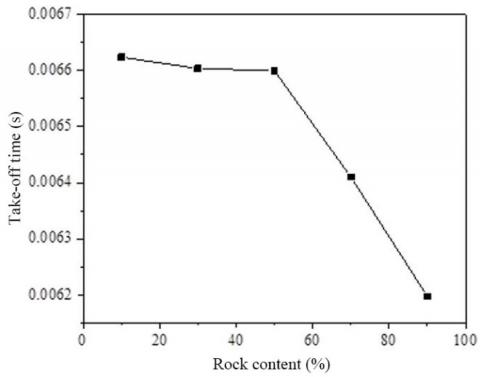
From the time-domain waveforms with different rock contents, the relationships between rock content of the soil-rock mixture and amplitude of the first wave, and the take-off time (peak arrival time) were obtained (Figure 12-13).
Figure 12. The relationship between rock content and first wave amplitude
Figure 13. The relationship between rock content and take-off time
As shown in Figures 12 and 13, with the growing rock content, the first wave amplitude gradually increased, while the take-off time shortened. By peak velocity, the three media, namely, pure soil, pure rock, and soil-rock mixture, could be ranked as pure rock > soil-rock mixture > pure soil.
Under the effects of soil and block stones, the wave propagates non-uniformly in soil-rock mixture. As a result, higher rock content speeds up the propagation velocity in the mixture, amplifies the displacement at each point on the right side, and shortens the time to reach the first peak.
Therefore, it can be concluded that: In the soil-rock mixture (1) the first wave amplitude increases with rock content; (2) the take-off time decreases with the growing rock content.
4.1.2 Influence law of feature size of block stone
From the time-domain waveforms with different feature sizes of block stone, the relationships between feature size of block stone in the soil-rock mixture and amplitude of the first wave, and the take-off time were obtained (Figure 14-15).
As shown in Figures 14 and 15, with the growing feature size of block stone, the first wave amplitude gradually decreased. Under the same rock content of 30%, the greater the feature size of block stone, the smaller the displacements at the measuring points, that is, the slower the velocities, and the longer the take-off time at these points.
Figure 14. The relationship between feature size of block stone and first wave amplitude
Figure 15. The relationship between feature size of block stone and take-off time
It can be concluded that: In the soil-rock mixture, (1) the first wave amplitude decreases with the feature size of block stone; (2) the take-off time increases with the feature size of block stone.
4.1.3 Influence law of the shape of block stone
From the time-domain waveforms with different shapes of block stone, the relationships between the shape of block stone in the soil-rock mixture and amplitude of the first wave, and the take-off time (peak arrival time) were obtained (Figure 16-17). The particle state and size of the soil-rock mixture can basically reflect the overall formation process of the mixture. The mechanical features of the mixture in mechanics is the manifestation of the interaction between its internal particles [18].
As shown in Figures 16-17, as the block stones changed from spheres to squares and then to rectangles, the first wave amplitude gradually decreased, while the take-off time increased. This is because, for the soil-rock mixture with a high rock content, the block stones generate the highest friction in rectangular shape, followed in turn by square shape and spherical shape. Therefore, the first wave amplitudes of the mixtures with three different shapes of block stones exhibited the following pattern: spherical block stones had the highest peak, followed by square stones, and then by rectangular stones. In terms of take-off time, the rectangular block stones had the longest take-off time, followed in turn by square stones, and spherical stones.
Figure 16. The relationship between shape of block stone and first wave amplitude
Figure 17. The relationship between shape of block stone and take-off time
4.2 Frequency domain feature analysis
4.2.1 Influence law of rock content
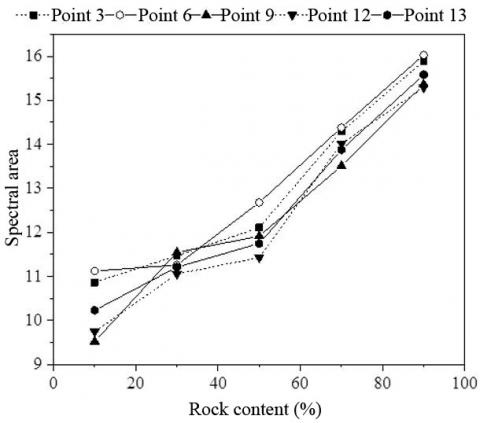
From the time-domain waveforms with different rock contents, the wave signal was extracted from the soil-rock mixture, and processed by Fourier transform and wavelet transform, producing the corresponding frequency-domain waveforms. From the obtained waveforms, the frequency-domain parameters sensitive to rock content (maximum amplitude, dominant frequency, and spectral area) were identified, and their variations with rock content were analyzed.
Figure 18. The relationship between rock content and maximum amplitude
Figure 19. The relationship between rock content and dominant frequency
Figure 20. The relationship between rock content and spectral area
Figures 18-20 show the variations of frequency-domain parameters (maximum amplitude, dominant frequency, and spectral area) with rock content at different measuring points. The abscissa is the stone content (10%-90%), and the ordinate is maximum amplitude, dominant frequency, and spectral area, respectively. It can be seen that, with the growing rock content, the maximum amplitude, dominant frequency, and spectral area all exhibited an increasing trend.
4.2.2 Influence law of feature size of block stone
From the time-domain waveforms with different feature sizes of block stone, the wave signal was extracted from the soil-rock mixture, and processed by Fourier transform and wavelet transform, producing the corresponding frequency-domain waveforms. From the obtained waveforms, the frequency-domain parameters sensitive to the feature size of block stone (maximum amplitude, dominant frequency, and spectral area) were identified, and their variations with the feature size of block stone were analyzed.
Figure 21. The relationship between feature size of block stone and maximum amplitude
Figure 22. The relationship between feature size of block stone and dominant frequency
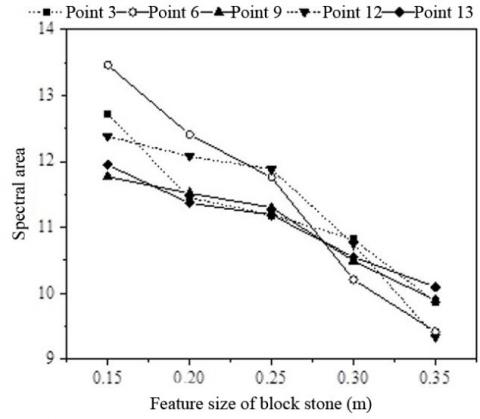
Figure 23. The relationship between feature size of block stone and spectral area
Figures 21-23 show the variations of frequency-domain parameters (maximum amplitude, dominant frequency, and spectral area) with feature size of block stone at different measuring points. The abscissa is the radius of block stone (0.15m-0.35m), and the ordinate is maximum amplitude, dominant frequency, and spectral area, respectively. It can be seen that, with the growing feature size of block stone, the maximum amplitude, dominant frequency, and spectral area all exhibited a decreasing trend.
4.2.3 Influence law of shape of block stone
From the time-domain waveforms with different shapes of block stone, the wave signal was extracted from the soil-rock mixture, and processed by Fourier transform and wavelet transform, producing the corresponding frequency-domain waveforms. From the obtained waveforms, the frequency-domain parameters sensitive to the feature size of block stone (maximum amplitude, dominant frequency, and spectral area) were identified, and their variations with the shape of block stone were analyzed.
Figure 24. The relationship between shape of block stone and dominant frequency
Figure 25. The relationship between shape of block stone and maximum amplitude
Figure 26. The relationship between shape of block stone and spectral area
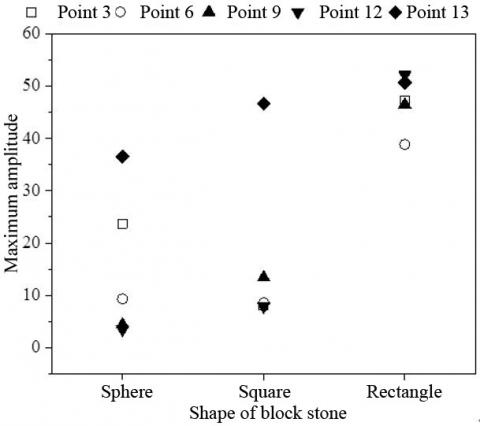
Figures 24-26 show the variations of frequency-domain parameters (maximum amplitude, dominant frequency, and spectral area) with the shape of block stone at different measuring points. The abscissa is the shapes of block stone (sphere, square, and rectangle), and the ordinate is maximum amplitude, dominant frequency, and spectral area, respectively. It can be seen that, the maximum amplitude and spectral area did not exhibit any clear change law; but the dominant frequency obeyed the following trend: square block stones had the highest dominant frequency, followed in turn by rectangular block stones, and spherical stones.
To disclose the internal meso-structure of soil-rock mixture, this paper establishes the PFC model of soil-rock mixture, and applies the model to analyze the wave propagation in the mixture. On this basis, the authors discussed how the meso-structure of the mixture affects the wave propagation features. The main conclusions are as follows:
(1) Starting with the waveform features obtained by numerical simulation, the variations of time-frequency wave parameters were observed with different meso-structure parameters. The results show that: With the growing rock content, the first wave amplitude increased, while the take-off time shortened; With the growing feature size of block stone, the first wave amplitude gradually decreased, while the take-off time gradually lengthened; The soil-rock mixture containing spherical block stones had the highest first wave amplitude and shortest take-off time, while the mixture containing rectangular block stones had the lowest first wave amplitude and longest take-off time.
(2) From the frequency-domain signal, the relationship between frequency-domain wave parameter’s and the meso-structure parameters of soil-rock mixture was derived as: With the growing rock content, the maximum amplitude, dominant frequency, and spectral area all exhibited an increasing trend; With the growing feature size of block stone, the maximum amplitude, dominant frequency, and spectral area all exhibited a decreasing trend.
The research in this manuscript is funded by the Chongqing Research Program of Basic Research and Frontier Technology (Grant No.: cstc2017jcyjBX0066).
[1] Jin, L., Zeng, Y.W. (2018). Refined simulation for macro-and meso-mechanical properties and failure mechanism of soil-rock mixture by 3D DEM. Journal of Rock Mechanics and Engineering, 37(6): 1540-1550. https://doi.org/10.13722/j.cnki.jrme.2017.1378
[2] Medley, E., Lindquist, E.S. (1995). The engineering significance of the scale-independence of some Franciscan melanges in California, USA. In The 35th US Symposium on Rock Mechanics (USRMS). American Rock Mechanics Association.
[3] Li, X., Liao, Q.L., He, J.M. (2004). In-situ tests and a stochastic structural model of rock and soil aggregate in the three gorges reservoir area, China. International Journal of Rock Mechanics and Mining Sciences, 41: 702-707. https://doi.org/10.1016/j.ijrmms.2004.03.122
[4] Yu, J.W., Gou, Z.L., Lei, Y., Pan, B.B. (2019). Inverse Fourier transform-based study on generating model of soil-rock mixture. Water Resources and Hydropower Engineering, 50(4): 7-15. https://doi.org/10.13928/j.cnki.wrahe.2019.04.002
[5] Lanaro, F., Tolppanen, P. (2002). 3D characterization of coarse aggregates. Engineering Geology, 65(1): 17-30. https://doi.org/10.1016/S0013-7952(01)00133-8
[6] Lafond, J.A., Han, L., Allaire, S.E., Dutilleul, P. (2012). Multifractal properties of porosity as calculated from computed tomography (CT) images of a sandy soil, in relation to soil gas diffusion and linked soil physical properties. European Journal of Soil Science, 63(6): 861-873. https://doi.org/10.1111/j.1365-2389.2012.01496.x
[7] Sass, O., Krautblatter, M. (2007). Debris flow-dominated and rockfall-dominated talus slopes: Genetic models derived from GPR measurements. Geomorphology, 86(1-2): 176-192. https://doi.org/10.1016/j.geomorph.2006.08.012
[8] Biot, M.A. (1956). Theory of propagation of waves in fluid-saturated porous solid(I). The Journal of the Acoustical Society of America, 28(2): 168-l78. https://doi.org/10.1121/1.1908239
[9] Ghorai, A.P., Samal, S.K., Mahanti, N.C. (2010). Love waves in a fluid-saturated porous layer under a rigid boundary and lying over an elastic half-space under gravity. Applied Mathematical Modelling, 34(7): 1873-1883. https://doi.org/10.1016/j.apm.2009.10.004
[10] Chen, W., Xia, T., Hu, W. (2011). A mixture theory analysis for the surface-wave propagation in an unsaturated porous medium. International Journal of Solids and Structures, 48(16-17): 2402-2412. https://doi.org/10.1016/j.ijsolstr.2011.04.015
[11] Wang, Q.F., Peng, J.J., Liu, C.F. (2014). Theoretical and experimental investigation on s-wave propagation of soil-stone medium. Journal of Chongqing Jiaotong University (Natural Sciences), 33(1): 94-97, 110. https://doi.org/10.3969/j.issn.1674-0696.2014.21
[12] Zhu S., Feng Y.M., Feng S.R., Chen, W.Y. (2011). Particles gradation optimization of blasting rockfill based on fractal theory. Advanced Materials Research, 366(366): 469-473. https://doi.org/10.4028/www.scientific.net/AMR.366.469
[13] Varadarajan, A., Sharma, K.G., Venkatachalam, K., Gupta, A.K. (2003). Testing and modeling two rockfill materials. Journal of Geotechnical and Geoenvironmental Engineering, 129(3): 206-218. https://doi.org/10.1061/(ASCE)1090-0241(2003)129:3(206)
[14] Xu, W.J., Hu, R.L. (2009). Conception, classification and significations of soil-rock mixture. Hydrogeology and Engineering Geology, 36(4): 50-56, 70. https://doi.org/10.3969/j.issn.1000-3665.2009.04.012
[15] Li, Y. (2013). Effects of particle shape and size distribution on the shear strength behavior of composite soils. Bulletin of Engineering Geology and the Environment, 72(3-4): 371-381. https://doi.org/10.1007/s10064-013-0482-7
[16] Lindquist, E.S. (1995). The strength and deformation properties of melange. University of California at Berkeley.
[17] Zhang, S., Tang H.M. (2015). Research on soil-rock mixture stochastic model based on meso-structural statistical characteristics. Yangtze River, 46(16): 48-52, 79. https://doi.org/10.16232/j.cnki.1001-4179.2015.16.012
[18] Jin, L., Zeng, Y.W., Zhang, S. (2017). Large scale triaxial tests on effects of rock block proportion and shape on mechanical properties of cemented soil-rock mixture. Rock and Soil Mechanics, 38(1): 141-149. https://doi.org/10.16285/j.rsm.2017.01.018