Fatiha Bouhadjela* | Bourassia Bensaad | Rahmouna Cheriet | Mohammed Belharizi | Soufyane Belhenini
© 2020 IIETA. This article is published by IIETA and is licensed under the CC BY 4.0 license (http://creativecommons.org/licenses/by/4.0/).
OPEN ACCESS
The mechanical and thermal contact behaviour between two solids depends mainly on the contact geometry and the nature of these two solids. It is concluded that for rough surfaces in plastic contact the real contact is affected by the materials hardness, the surfaces roughness and the evolution of the mechanical contact deformation. The aim of the present study is to compare results obtained from experimental work on Vickers hardness of brass to those of the real contact pressure (RCP) obtained by numeric simulation. Hardness and RCP have been selected as physical quantities. For the numerical simulation, three three-dimensional element models are developed; firstly, we simulated Vickers assay using rigid indentor and a deformed plane surface of brass. In the second model we considered a brass indenter in contact with hard plane surface. The dimensions of the second model were changed to create the third model. The obtained results from the numeric models were in agreement with the experimental findings and confirmed the hypothesis of Abbott and Firstone. The three models of simulation may help to select the model that give the best results in short time.
vickers hardness, contact pressure, plastic deformation, elastic deformation, three-dimensional modeling
The thermal transfer is widely studied in literature [1-14] and all these studies were based on the correlation between the real contact rate and the hardness of the deformed material. This important correlation was combined to the mathematical description of the rough surfaces which is developed to update the definition of the real contact rat. Thus, the scientists discovered that the real contact is not only related to the hardness of materials but also to the roughness of surfaces in contact and the evolution of the mechanical state of in-contact materials [15-28]. We used ANSYS software to simulate solid-solid contact since getting all the required information about the mechanical characteristics and behaviour of the asperity peaks are highly difficult. Numerical simulation is widely used to predict the mechanical behavioral of materials. It is a solution that excels mainly during the development phases and leads to reduce number and cost of realized prototypes. Numerical simulation remains a valuable tool in different fields by changing wide range of multiphysics and multiscale parameters such as geometry, laws of behavior of materials and boundary conditions [27].
The aim of the present study is to compare results obtained from experimental work on Vickers hardness of brass to those of the real contact pressure (RCP) obtained by numeric simulation.
Three-dimensional (3D) finite elements models are developed and validated by experimental results [27]. Thus, the real contact pressure (RCP) could be used in the semi-empirical models to predict thermal contact resistance (TCR).
Thermal and mechanic behavior of solid-solid contact is mainly related to the geometry of contact and the nature of these two solids. The contacting of two virgin surfaces leads to a quasi-isostatic contact and the mechanical loading helps to bring closer the in-contact surface plans by increasing the contact points. Therefore, strong increase of the load leads to the spreading and coalescence of contact points. Compression mechanical load results in a complex and discrete deformed area due to the distribution of contact points. These mechanisms in combination lead to: increase the real rate of contact S* and contact point density N; decrease the distance between in-contact surface plans d and so decrease the TCR. The three parameters S*, d and N have a significant role in the characterization of the real contact. These parameters can be determined by two different methods. The first one is based on mathematical expressions using the mechanical properties of in-contact materials [28, 29], while in the second method these parameters are measured directly by analyzing topographic data of in-contact surfaces [19-21].
Regarding the asperity on Figure 1, the compression loading gives rise to a stress concentration at the highest in-contact asperity peak. In the two embraced environments, the normal stress field sn, is defined by the ratio of the applied load F by the straight section of the asperity to the abscissa x s (x, t) [29, 30]. Since sn(x) is lower to the elastic limit of a materialse, the deformations remain elastics, however, as soon as sn(x) gains se all deformations become plastics.
Figure 1. schema of a loaded contact between two rough surfaces
If the flow of material is plastic at solid-solid contact area, the deformation of the rough surface would be equivalent to its truncation at its intersection with the hard plan. The real contact area is defined by the geometric intersection of plan surface with the original profile of the rough surface [15]. The volume of the displaced material by the indentation is not preserved. The average pression at the real surface of contact equals to the asperity hardness H, therefore the total load F is proportional to the real contact area.
A hardness test involves the contact of a shape indenter and controlled properties with a plane surface subject to the study of the mechanical properties [31].
For the hemispheric asperities, the hardness H represents Brinell hardness HB of the softest material [18]. Therefore, the real pression of contact is expressed by HB. The plastic flow is formed when Hertz maximal contact pression (PH) equals to 0.6 HB [18]. From these results is introduced the plastic displacement dp related to Brinell hardness HB and plasticity index F[19]. For more important loads, it has been confirmed that the volume of asperities is conserved throughout the plastic deformation [22]. The adjacent asperities influence becomes predominant as the applied force against the asperities is very high [25].
To take into consideration the asperities form and its microscopic scale, Brinell hardness is replaced in Bowden and Tabor formula by Vickers micro-hardness of soft and smooth plans [32-34]. It is not possible to make this correlation as a standard as it ignores the evolution of asperities micro-hardness due to the hardening phenomenon during the loading and its dependence to the roughness parameters. These two points must be taken into consideration especially in case where asperities of rough surfaces deform instead of penetrating the smooth surface. Collaghan et al. [34] proposed a new basic notion, the effective hardness HC, which is expressed in relation to either micro-hardness HV, the applied load P and the roughness of the surface. The real level of contact keeps the same expression where HC replaces HV.
$S^{*}=\frac{P}{H_{c}}$
HC is expressed in terms of Hv. The apparent applied pressure is ten times higher to Vickers micro-hardness value.
The hardness measures reveal that for low loads, the hardness decreases in accordance to the applied load and the depth of the indenter penetration [8, 27, 35, 36]. The increase of the obtained micro-hardness, going gradually to the superficial layer of the tested surface is due to the hardening and/or different processes of machining or treatment of the surface [37]. According to the nature of material, it is noted that from a certain value of the pressure, the value of hardness becomes constant and equal to the Brinell hardness. Because of this evolution which precedes the limit value given by Brinell hardness, many scientists confirmed that the micro-hardness cannot be separated from the surface state and therefore, they proposed a new definition, the effective micro-hardness HC [5, 7, 8, 13, 24, 26, 34, 38]. Many experiments revealed that HC is more important than Vickers hardness [8]. The effect of micro-hardness on Thermal Contact Resistance TCR revealed that HC gives a valuable estimation of TCR without indicting the level of precision [36]. Aiming to verify Abbott and Firstone hypothesis, and validating the HC notion, we compared the experimental values of Vickers hardness of brass with the RCP values obtained by numeric simulation. For this end we used three different configurations of sapphire-brass contact.
It is difficult to have clear details about mechanical proprieties and behavior properties of asperities peak; therefore, we used a numeric simulation to model solid-solid contact. It is a solution that excels mainly during development stage helping to reduce number and cost of the real prototypes. Furthermore, the numeric simulation remains a useful tool in different fields by changing all the multi-physics and multiscale parameters such as geometry, laws of material behavior and boundary conditions.
The experimental validation of the numeric model of Vickers hardness assay will help to evaluate the performance of the calculation tool and validate the numerical model of hard plan-deformed pyramid contact, giving that the latter has the same dimensions as Vickers indenter. Thus, the mechanical behavior of asperity’s peak and the evolution of its mechanical deformation could be determined. Based on the results obtained from the two models, we developed a third numerical model which reproduced exactly the configuration of the experimental contact studied by Bensaad [27, 36]. These findings could be used successfully to predict TCR by semi-empiric models.
The calculation of finite elements simulation in this paper were conducted using ANSYS software. We realized the mesh finite elements using solid226 element to model the deformed part of the structure presented by the brass. Hard plate/deformable (brass) contact was conducted using hard-soft contact elements (170-174). Solid226 is a 3D quadratic element and can treat all thermodynamic non-linear phenomenon in strong coupling. Furthermore, we used the contact element 174 and 170 to model and simulate the 3D contact without friction between the hard surface 170 and the deformed surface 174 in couple field, taking into consideration the thermal resistance of contact.
3.1 Studied models
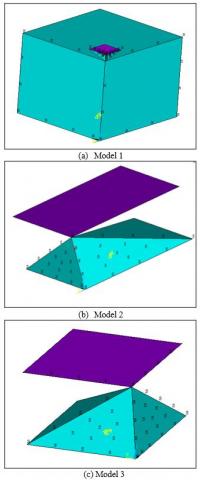
Using finite elements method, ANSYS software allows to create numeric models of three studied contacts; Figure 2 represents geometric models and mesh.
Figure 2. Geometric models and mesh of studied cases
3.2 Boundary conditions
In order to accurately reproduce the experimental conditions, we applied a pressure type loading. For the first model, Figure 3a, we applied a displacement to a pyramid which represents the indenter while the tested sample recessed at its base. For the second model, Figure 3b, we applied a displacement to the hard surface while the brass indenter is recessed. In the third model, Figure 3a, a displacement is applied on the plate that represents the hard surface whereas the teste sample is recessed.
Figure 3. Boundary conditions of the studied models
3.3 Material properties
The thermomechanical properties of the studied brass in the present study are [27]:
The stress-strain characteristic curve of brass is given in Figure 4 [27].
Figure 4. Stress-strain characteristic curve of brass [27]
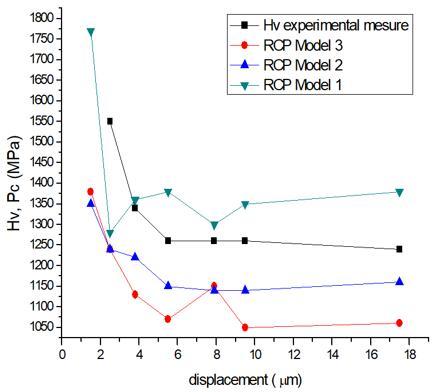
For the three models, the evolution of the RCP and the measured hardness according to the applied displacement is summarized in Figure 5. In the first model, we found that RCP decreased gradually with the increase of the applied load. Starting from the second load, the RCP value remained unchanged and equal to the experimental value of Vickers hardness. Furthermore, we found that for the first load the difference between the calculated RCP and the measured hardness equal to 17.7% of the measured hardness. For other loads the mean value of the difference between the calculated RCP and the measured hardness equal to 6.38% of the measured hardness. We found that the obtained results from the numerical simulation are in good accordance to the literature.
Figure 5. Evolution of the RCP and the measured hardness Hv [36] according to imposed displacement
For the second model, we inverted the configuration of Vickers assay, where the brass indenter must be crashed against the hard and smooth plane. For first load we found a difference of 20% of the measured hardness for RCP values. Starting from the second load, the difference becomes low and reaches 9%.
For the third model, we found, for the first load, that the difference between RCP and Vickers hardness values is about 20% of the measured value of Vickers hardness. Starting from the second load, the mean difference became equal to 12% of the measured hardness.
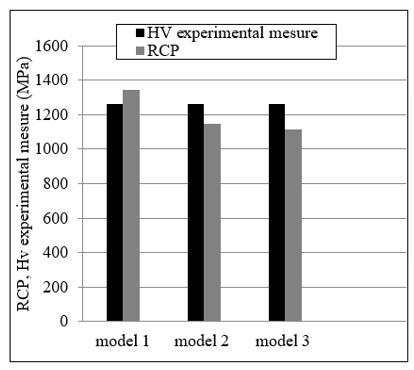
In Figure 6 we present the comparison of the average value of Vickers hardness with the average values of real contact pressure for each model. The average value is calculated for the last four points of each curve in Figure 5
In Figure 6, for the three studied cases, the distribution of the real contact pressure is visualized at the level of the top of the pyramidal asperity in contact with the smooth and flat surface.
Figure 6. Comparison of RCP and Hv values for the three studied cases
The present study aims to verify and confirm the hypothesis of Abbott and Firstone which stipulates that Vickers hardness is equal to RCP.
We present a comparative study between the experimental results of the Vickers hardness obtained by Bensaad, and the calculated values of the real pressure of the contact obtained by the numeric simulation. We have considered three models:
For the first model, we have simulated the Vickers test with a rigid pyramidal indenter and a brass plane, a deformable surface. In the second model, we considered a deformable indenter in contact with a rigid plane, inversely to the Vickers test. In the third model, we have reproduced faithfully the same configuration of the contact studied by Bensaad.
We confirmed that three different models of numerical simulation were in good accordance to the experimental findings and literature. It is clear that the maximum contact pressure is concentrated at the point of contact and close to the hardness Hv.
|
CP |
Contact pressure |
|
RCP |
Real contact pressure |
|
3D |
Three-dimensional |
|
TCR |
Thermal contact resistance |
|
S* |
Real contact rate |
|
N |
Contact point density |
|
d |
Distance between in contact surface plans |
|
σn |
Normal stress |
|
σe |
Elastic limit of the material |
|
H |
Hardness |
|
HB |
Brinell hardness |
|
PH |
Hertz maximal contact pressure |
|
δp |
Distance plastic |
|
Hc |
Hardness effective |
|
E |
Young’s module |
|
Hv |
Vickers hardness |
|
K |
Conductivity |
|
D |
Density |
|
Greek symbols |
|
|
Φ |
Plastisity index |
|
ν |
Poission coefficient |
[1] Negus, K.J., Yovanovich, M.M. (1988) Gap conductance integral for conforming rough surfaces. Technical Notes, J. Thermophysics, 279-281. http://www.mhtl.uwaterloo.ca/pdf_papers/mhtl88-5.pdf
[2] Greenwood, J.A. (1966). Constriction resistance and the real area of contact. British Journal of Applied Physics, 17: 1621-1632. https://doi.org/10.1088/0508-3443/17/12/310
[3] Cooper, M.G., Mikic, B.B., Yovanovich, M.M. (1968). Thermal contact conductance. Int. J. Heat Transfer, 12: 279-300. https://doi.org/10.1016/0017-9310(69)90011-8
[4] Yovanovich, M.M. (1981). Thermal contact correlations. 16th AIAA Thermophysics conference, Palo Alto, Calif. pp. 83-95. https://doi.org/10.2514/6.1981-1164
[5] Yovanovich, M., Hegazy, A., Devaal, J. (2012). Surface hardness distribution effects upon contact, gap and joint conductances. AIAA 82-0887, AIAA/ ASME 3rd Joint Thermophysics, Fluids, Plasma and Heat Transfer Conference, St. Loius, Missouri. https://doi.org/10.2514/6.1982-887
[6] Yovanovich, M., Hegazy, A., Devaal, J. (2012). Astatistical model to predict thermal gap conductance between conforming rough surfaces. AIAA/ ASME 3rd Joint Thermophysics, Fluids, Plasma and Heat Transfer Conference, St. Loius, Missouri. https://doi.org/10.2514/6.1982-888
[7] Yovanovich, M. (1982). New contact and gap conductance correlations for conforming rough surfaces. AIAA Paper No. 81-1164, AIAA 16th Thermophysics Conference, Palo Alto, CA. http://www.mhtl.uwaterloo.ca/old/paperlib/papers/contact/general/abstract5.html
[8] Yovanovich, M.M., Hegazy, A., Antonetti, V.W. (1983). Experimental verification of contact conductance models based upon distributed surface micro-hardnes. AIAA 21st Aerospace sciences Meeting, AIAA-83-0532: Conference Report.
[9] Song, S. (1988). Analytical and experimental study of heat transfer through gas layers of contact interfaces. Ph.D. Dissertation, Dept. of Mechanical Engineering, Univ. of Waterloo, Waterloo, ON, Canada. Bookmark: https://trove.nla.gov.au/version/21166356
[10] Antonetti, W.W., Whittle, T.D., Simons, R.E., (1993). An approximate thermal contact conductance correlation. Journal of Electronic Packaging, 151(1): 131-134. https://doi.org/10.1115/1.2909293
[11] Sridhar; M.R., Yovanovich, M. (1996). Thermal contact conductance of tool steel and comparison with model. Int. J. Heat Mass Transfer, 39(4): 831-839. https://doi.org/10.1016/0017-9310(95)00141-7
[12] Milanez, F.H, Yovanovich, M.M., Culham, J.R. (2002). Effect of surface asperity truncation on thermal contact conductance. IEEE Transactions on Components and Packaging Technologies, 26(1): 48-54. https://doi.org/10.1109/TCAPT.2003.811469
[13] Yovanovich, M., Morotta, E.E. (2003) Chapter 4. Thermal Spreading and contact resistances. Heat Transfer Handbook, John Wiley & Sons, Editors: Adrian Bejan and Alan D. Kraus, New York, NY.
[14] Milanez, F.H., Yovanovich, M.M., Mantelli, M.B.H. (2004). Thermal contact conductance at low contact pressure. J. of Thermophysics and Heat Transfer, 18(1). https://doi.org/10.2514/1.2259
[15] Abbott; E.J., Firestone, F.A. (1933). Specifying surface quality. Journal of Mechanical Engineering, 55: 569-572.
[16] Ishlinky, A.J. (1944). The axisymmetrical problem in plasticity and the Brinnel test. Prikladnaia Mathematicka I Mikhanika, pp: 8-204.
[17] Tabor, D. (1951). The hardness of materials. Oxford: Clarendon Press, New York: Oxford University Press, 2000. https://trove.nla.gov.au/version/44448604
[18] Bowden, F.P., Tabor, D. (1964). Friction and lubrication of solids. Part. I, Clarendon Press, Oxford.
[19] Greenwood, J.A., Williamsson, J.B.P. (1966) Contact of nominally flat surfaces. Proc. Royal Soc. A295, London, 300-319. https://doi.org/10.1098/rspa.1966.0242
[20] Mikic, B.B. (1971). Analytical studies of contact of nominally flat surfaces: Effect of previous loading. Journal of Lubrication Technology, 93(4): 451-456. https://doi.org/10.1115/1.3451616
[21] Nayak, P.B. (1973). Some aspects of surface roughness measurement. Wear, 26(2): 165-174. https://doi.org/10.1016/0043-1648(73)90132-4
[22] Pullen, J., Williamson, J.B.P. (1972). On the plastic contact of rough surfaces. Proc Royal Soc. A327:195-73. https://doi.org/10.1098/rspa.1972.0038
[23] Hisakado, T., Tsukizoe, T. (1974). Effects of distribution of slopes and flow pressures of contact asperities on contact between solid surfaces. Wear, 30(2): 213-227. https://doi.org/10.1016/0043-1648(74)90176-8
[24] Song, S., Yovanovich, M. (1988). Relative contact pressure: dependence upon surface roughness and Vickers Microhardness. Journal of Thermophysics and Heat Transfer, 2(2): 43-47. https://arc.aiaa.org/doi/pdf/10.2514/3.60
[25] Adams, G.G., Nosonovsky, M. (2000). Contact modelling-forces. Tribology International, 33(5-6): 431-442. https://doi.org/10.1016/S0301-679X(00)00063-3
[26] Yovanovich, M. (2006). Micro and macro hardness measurements, correlations and contact models. 44th AIAA Aerospace Sciences Meeting and Exibit, Reno, Nevada, 9-12. https://doi.org/10.2514/6.2006-979
[27] Bensaad, B. (2008). Experimental study of evolution and of establishment of the state of surface of a metallic material in contact with a plan of sapphire: Application has the modelling of the thermal resistance of contact. Polytechnic School of the University of Nantes.
[28] Thomas, T.R. (1982). Rough surfaces. Longman, London and New York.
[29] Bensaad, B., Bourouga, B. (2019). Analysis of the evolution of the structure of a surface with pyramidal asperities in contact with a hard and smooth plane. Journal of Heat Transfer, 142(1): 011401. https://doi.org/10.1115/1.4045303
[30] Goiset, V. (1999). Experimental study of the mechanisms of thermal transfers to the interface of contact Room-Tool during an operation of forging in heat. Doctoral dissertation. University of Nantes.
[31] Dominique, F. (2005). Mechanical, Trials of metals. M4 160 Technique of engineer.
[32] O’Callaghan, P.W., Cameron, M.A. (1970). Real area of contact between a rough surface and softer optically flat surface. Journal Mechanical Engineering Science, 4(12): 259-267. https://doi.org/10.1243/JMES_JOUR_1970_012_047_02
[33] Menalo, F., Mohamed, G., Khatab, A.A. (2010). Development of primary vickers hardness testing machine. Materials Science.
[34] Weiler, W. (2019). Relationship between vickers hardness and universal hardness. NASF Surface Technology White Papers, Federal Institute of Physics and Technology Braunschweig, Germany.
[35] O’Callaghan, P.W., Probert, S.D. (1973). Effects of static loading on surface parameters. Wear, 24(2): 133-145. https://doi.org/10.1016/0043-1648(73)90226-3
[36] Milanez, F.H., Culham, J.R., Yovanovich, M.M. (2003). Comparison between Plastic contact hardness models and experiment. AIAA paper No. -0160, 41th AIAA Aerospace Meeting and Exibit, Reno. https://doi.org/10.2514/6.2003-160
[37] Fortunier, R. (2001). Mechanical Behavior of Materials. National School of Mines. 158 lessons Fauriel, 42023 cedex Saint-Étienne 2.
[38] Esteban, B. (2016). Indentation Hardness Measurements at Macro-, Micro-, and Nano-scale: A Critical Overview. Springer. https://doi.org/10.1007/s11249-016-0805-5