Tayeb Kebir* | Zine El Abidine Harchouche | Abbes Elmeiche | Mohamed Benguediab
OPEN ACCESS
It is extremely difficult to measure the strain energy dissipated in each loading cycle, especially when the material suffers from low cycle fatigue under plastic strain. This paper attempts to simulate the dissipated strain energy of aluminum alloy 6061-T6 induced by the low cycle fatigue under an imposed plastic strain. Hence, an ANSYS numerical simulation was performed on the low cycle fatigue permitting to generate the hysteresis loops at failure of each cyclic plastic strain imposed on aluminum alloy 6061-T6. The area of the hysteresis loops was adopted to measure the dissipated strain energy. The simulation results show that the energy dissipated during loading gives a good measure of a material’s residual strength, stiffness and capacity to resist further loading.
dissipated strain energy, low cycle fatigue, imposed plastic strain, hysteresis loop, alloy 6061-T6
The tests of low cycle fatigue at a plastic strain imposed have been used to modeling the hysteresis loops and subject of several studies in the literature [1-4]. Investigation of the low cycle fatigue of materials focused on changes in the dislocation microstructures of each cycle, residual strain after initial unloading under Bouchenger effect, stiffness of each cycle and energy dissipated as a result of cycling. These properties have a large impact on a structure’s performance [5]. Also, it is now clear that energy is dissipated in fatigue because of plastic deformation, which gives rise to the changes in material structure, such as phase changes, development of residual stress, translation of dislocations, and the creation and/or enlargement of internal surfaces such as voids and cracks [3].
Thus, when the hysteresis loops generated, the area of these hysteresis can be presenting the stain energy dissipated [6-7]. The enclosed area in the loop is the strain energy per unit volume released as heat in each loading cycle [8]. Therefore, during loading, dissipated strain energy is increased significantly, in the unloading test, the elastic strain energy is released at the stress drop point, while the dissipated strain energy increases sharply [9-10]. However, the energy dissipation process is associated with the entire process of material deformation, thus resulting in material failure [9, 11].
The adoption point of view of energy quantities, if they are well chosen, constitutes an indicator allow quantifying the microstructure irreversibility which will have repercussions on the macroscopic properties [12]. The existence of different energy quantities is related to the strain energy is not completely dissipated in cyclic loading, a part; called energy stocked, remain in material. The energy stocked is linked to the multiplication of defect in material such as dislocations. As small crack of fatigue is often due to the multiplication and organization of dislocations, some studies have attempted to use energy stocked to characterize fatigue damage of materials. For example, the works of Ref. [13] are showed a correlation between the energy stocked and the accumulation of damage. Furthermore, the magnitude of the stored strain energy is not characterized fully by the dislocation density and likely depends on dislocation arrangements and the resultant patterns developed as a result of cyclic strain accommodation [12, 13].
The Wohler curve is based on the estimation of the endurance limit determined by statistical methods that prove to be long and expensive for industrial applications. Also, other approaches are based on energy dissipated have been developed to determine this limit [10, 14, 15]. The correlation between dissipated energy and the endurance limit remain poorly understood [16]. In addition, a strain energy based fatigue damage model is proposed which uses the strain energy from applied loads and the strain energy of dislocations to calculate stress-life, strain-life, and fatigue crack growth rates [17, 18].
The purpose of this work is to simulate the low cycle fatigue at a plastic strain imposed and to determine the strain energy dissipated from area of the hysteresis loops generated and can be observed horizontal asymptote energy in curve of Energy-Number of cycle, as similarly of endurance limit, using the aluminum alloy 6061-T6. The simulation has been released by the ANSYS code.
Experimental measurements are often too expensive and time-consuming especially when components are subjected to long cyclic loading histories in service. Therefore, finite element analysis predictions have been widely used by researchers for evaluating the different models used for low cycle fatigue [1, 12, 19].
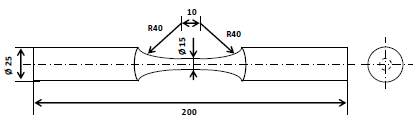
For the low cycle fatigue testing is used a smooth cylindrical specimen subjected to uniaxial forces, done according to the standard test E606 [20], as presented in Figure 1.
Figure 1. Geometry and dimensions of the specimens used in the strain-controlled fatigue tests (Dimensions in mm)
The material studied is aluminum alloy 6061-T6 for which static and cyclic mechanical properties are obtained by Brammer, Ambriz and Jaramillo [21, 22], shown in Table 1. This material has great importance in the technology industry especially in the construction of a transport aircraft that is due to the high mechanical strength and good corrosion resistance and high hardness.
Figure 2. Cyclic stress-strain at ratio R = -1
Table 1. Static and cyclic mechanical properties of 6061-T6
|
Young’s modulus E (GPa) |
67.8 |
|
Poisson’s ratio ν |
0.3 |
|
Yield strength σe (MPa) |
279 |
|
Ultimate tensile strength σu (MPa) |
310 |
|
Elongation εf (%) |
14.0 |
|
Fatigue strength coefficient σ'f (MPa) |
705 |
|
Fatigue ductility coefficient ε'f |
2.40 |
|
Fatigue strength exponent b |
-0.11 |
|
Fatigue ductility exponent c |
-0.98 |
|
Hardening coefficient K’ (MPa) |
502.8 |
|
Hardening exponent n' |
0.0737 |
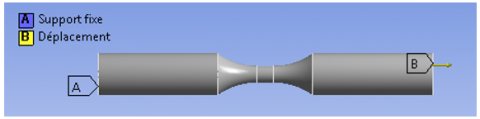
For tested this alloy a series of low cycle fatigue simulations at imposed plastic strain amplitude were carried out for different levels according to ASTM E606 standard test [20] as shown in Figure 3. Also, the chosen values of plastic strain imposed that is according to the work experimental [23] as shown in Table 3.
Figure 3. Displacement applied in test specimen
Table 2. Cyclic plastic strain imposed
|
Material |
Plastic strain imposed in % |
||||
|
6061-T6 |
0.4 |
0.5 |
0.6 |
0.7 |
1.0 |
Figure 4. Test specimen meshing
The present work constitutes a numerical simulation of low cycle fatigue permitting to generate the hysteresis loops at failure of each cyclic plastic strain imposed of aluminum alloy 6061-T6, using the Software ANSYS. The area of these hysteresis loops facilitated us to measure the strain energy dissipated.
The Figure 5 shows the life time obtained by one simulation to low cycle fatigue for 0.5 % controlled cyclic plastic strain in aluminum alloy 6061-T6.
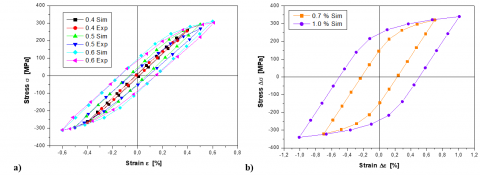
The stabilized hysteresis loops for each level of cyclic plastic strain imposed for the alloy studied are shown in Figure 6. However, the results (Figure 5a) obtained for the 6061-T6 alloy are explained the simulation hysteresis loops showed good agreement with experimental results [21]. Also, the Figure 6b shows the following stable hysteresis loops, measured at different values of plastic strain amplitude for the same material.
Figure 5. Lifetime obtained by 0.5 % controlled cyclic plastic strain in aluminum alloy 6061-T6
Figure 6. Simulation of hysteresis loops for 6061 T6 aluminum, a) with experimental results [21], b) without experimental results
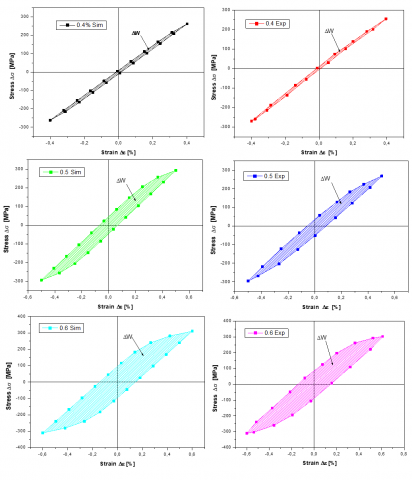
According to these results and for determined the plastic strain energy dissipated at failure we will make a measurement on each area of these hysteresis loops. The Figure 7 represents the hysteresis loops stabilized at failure for each level cyclic plastic strain imposed of the alloy studied. It can be remarked that the plastic strain imposed increase, increasing the hysteresis loops. The area hatching for each hysteresis loops is measured by Software Origin (Origin is a visualization program that produces graphs and plots intended for direct incorporation in research publications) and shown the total plastic strain energy dissipated at failure which evolve proportionally with plastic strain imposed, this is explained by the material provide a lot of energy stored. However, in the absence of molecular slip and other mechanisms for energy dissipation, this mechanical energy is stored reversibly within the material as strain energy. When the stresses are low enough that the material remains in the elastic range, it’s just according to the small area, see Figure 7.
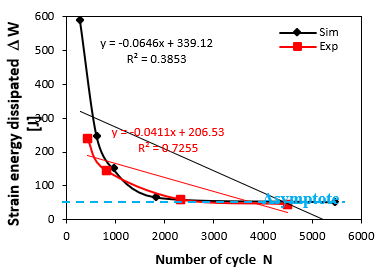
For seems the relationship the strain energy by number of cycles, we are going to design the strain energy obtained by area of these hysteresis loops for each strain imposed versus number of cycles, see Figure 8. We have remarked that the energy dissipated due to plastic strain imposed increases, increasing the number of cycles [14, 24]. Also, it can be observed that the plastic strain energy attained (or exceed) the value of energy stored, the material suffers a short life. Therefore, the plastic strain energy dissipated evolves inversely with energy stored relative to the number of cycles. It has been suggested by [12, 15] and [4] and others that the hysteresis plastic strain energy is related to the number of cycles to failure Nf (also to the number of reversals to failure 2 Nf) by a power function and can be written as follows:
$\Delta W=A\left(2 N_{f}\right)^{\alpha}$ (1)
where, A and α are material constants, representing material energy absorption capacity and fatigue exponent, respectively. In the case, can be deduce the values of these parameters from a linear regression and are given in Table 4. These values are comparable to those from the literature for this type of alloy and realized a comparison acceptable.
Table 3. Material constants
|
6061-T6 |
A (J) |
α |
|
Simulation |
339.1 |
-0.064 |
|
Experimental [21] |
206.5 |
-0.064 |
Figure 7. The energy by area of hysteresis loops at failure of each level cyclic plastic strain imposed, (right) simulation results, (left) experimental results [21]
Figure 8. Strain energy dissipated versus number of cycles at failure for area of hysteresis loops
This work of numerical study of the strain energy dissipated due to the low cycle fatigue tests at a cyclic strain imposed for the Aluminum alloy 6061-T6. The main conclusions that were drawn from this study are:
Finally, from the results of the simulation, we found that the energy dissipated during loading, as a fraction of the total energy dissipation capacity, gives a good measure of a materials residual strength, stiffness and capacity to resist further loading. The investigation of these properties is meant to give a picture of the expected performance.
|
E |
Young’s modulus Gpa |
|
K’ |
Hardening coefficient MPa |
|
n' |
Hardening exponent |
|
b |
Fatigue strength exponent |
|
c |
Fatigue ductility exponent |
|
J |
Material constants |
|
L |
length |
Greek symbols
|
ν |
Poisson’s ratio |
|
σe |
Yield strength MPa |
|
σu |
Ultimate tensile strength MPa |
|
σ'f |
Fatigue strength coefficient MPa |
|
εf |
Elongation % |
|
ε'f |
Fatigue ductility coefficient |
|
$\alpha$ |
Material constants |
|
$\Delta W$ |
Strain energy dissipated |
[1] Kebir, T., Benguediab, M., Miloudi, A., IMAD, A. (2017). Simulation of the cyclic hardening behavior of Aluminum alloys. UPB Sci. Bull. Ser. D Mech. Eng., 79(4): 240-50.
[2] Shen, S., Airey, G.D., Carpenter, S.H., Huang, H. (2006). A dissipated energy approach to fatigue evaluation. Road Mater. Pavement Des., 7(1): 47-69. https://doi.org/10.1080/14680629.2006.9690026.
[3] Ye, D.Y., Wang, Z.L. (2001). A new approach to low-cycle fatigue damage based on exhaustion of static toughness and dissipation of cyclic plastic strain energy during fatigue. Int. J. Fatigue, 23(8): 679-687. https://doi.org/10.1016/S0142-1123(01)00027-5
[4] Abdalla, J.A., Hawileh, R.A., Oudah, F., Abdelrahman, K. (2009). Energy-based prediction of low-cycle fatigue life of BS 460B and BS B500B steel bars. Mater. Des., 30(10): 4405-4413. https://doi.org/10.1016/j.matdes.2009.04.003
[5] Agrawal, R., Uddanwadiker, R., Padole, P. (2014). Low cycle fatigue life prediction. Int. J. Emerg. Eng. Res. Technol., 2(4): 5-15.
[6] Emuakpor, O.S., George, T., Cross, C., Shen, M.H.H. (2010). Hysteresis-loop representation for strain energy calculation and fatigue assessment. J. Strain Anal. Eng. Des., 45(4): 275-282. https://doi.org/10.1243/03093247JSA602
[7] Gordon, P.M. (2001). Low cycle fatigue behavior of concrete with recycled concrete aggregates. Thesis of Master of Science in Civil and Environmental Engineering, Faculty of California Polytechnic State University.
[8] Roylance, D. (2001). Stress-Strain curves. Department of Materials Science and Engineering Massachusetts Institute of Technology Cambridge, MA 02139.
[9] Zhang, L., Ren, M., Ma, S., Wang, Z. (2014). Energy dissipation mechanism and damage model of marble failure under two stress paths. Frat. Ed Integrita Strutt., 30: 515-525. https://doi.org/10.3221/IGF-ESIS.30.62
[10] Lefebvre, D., Ellyin, F. (1984). Cyclic response and inelastic strain energy in low cycle fatigue. Int. J. Fatigue, 6(1): 9-15. https://doi.org/10.1016/0142-1123(84)90003-3
[11] Meneghetti, G., Ricotta, M., Atzori, B. (2015). Experimental evaluation of fatigue damage in two-stage loading tests based on the energy dissipation. Proc. Inst. Mech. Eng. Part C J. Mech. Eng. Sci., 229(7): 1280-1291. https://doi.org/10.1177/0954406214559112
[12] Mareau, C., Cuillerier, D., Morel, F. (2013). Experimental and numerical study of the evolution of stored and dissipated energies in a medium carbon steel under cyclic loading. Mech. Mater, 60: 93-106. https://doi.org/10.1016/j.mechmat.2013.01.011
[13] Warren, J., Wei, D.Y. (2010). A microscopic stored energy approach to generalize fatigue life stress ratios. Int. J. Fatigue, 32(11): 1853-1861. https://doi.org/10.1016/j.ijfatigue.2010.05.003
[14] Erberik, A., Sucuoglu, H. (2004). Seismic energy dissipation in deteriorating systems through low-cycle fatigue. Earthq. Eng. Struct. Dyn., 33(1): 49-67. https://doi.org/10.1002/eqe.337
[15] Zghal, J. (2016). Etude du comportement en fatigue à grand nombre de cycles d’un acier à haute limite d’élasticité HC360LA : endommagement , plasticité et phénomènes dissipatifs associés. PhD Thesis, Ecole Nationale Supérieure d’Arts et Métiers – ENSAM.
[16] Berthel, B., Chrysochoos, A., Wattrisse, B., Galtier, A. (2008). Infrared image processing for the calorimetric analysis of fatigue phenomena. Exp. Mech., 48(1): 79-90. https://doi.org/10.1007/s11340-007-9092-2
[17] Huffman, P.J. (2016). A strain energy based damage model for fatigue crack initiation and growth. Int. J. Fatigue, 88: 197–204. https://doi.org/10.1016/j.ijfatigue.2016.03.032
[18] Huffman, P., J. Ferreira, J.A.F.O. Correia, A.M.P.D.J., Lesiuk, G., Berto, F., Fernández-Canteli, A., Glinka, G. (2017). Fatigue crack propagation prediction of a pressure vessel mild steel based on a strain energy density model. Frat. Ed Integrità Strutt, 42: 170-180. https://doi.org/10.3221/IGF-ESIS.42.18
[19] Korsunsky, A.M., Dini, D., Dunne, F.P.E., Walsh, M.J. (2007). Comparative assessment of dissipated energy and other fatigue criteria. Int. J. Fatigue, 29(9-11): 1990-1995. https://doi.org/10.1016/j.ijfatigue.2007.01.007
[20] ASTM. (2012). Standard test method for strain-controlled fatigue testing. In: Designation: E606/E606M −12, ASTM, 1-16. https://doi.org/10.1520/E0606-04E01
[21] Brammer, A.T. (2013). Experiments and modeling of the effects of heat exposure on fatigue of 6061 and 7075 aluminum alloys. Master of science, University of Alabama.
[22] Ambriz, R.R., Jaramillo, D. (2014). Mechanical behavior of precipitation hardened aluminum alloys welds. InTech, pp. 36-58.
[23] Lipski, A., Mrozinski, S. (2012). The effects of temperature on the strength properties of aluminium alloy 2024-T3. Acta Mech. Autom., 6(3): 62-66.
[24] Giancane, S., Chrysochoos, A., Dattoma, V., Wattrisse, B. (2009). Deformation and dissipated energies for high cycle fatigue of 2024-T3 aluminium alloy. Theor. Appl. Fract. Mech., 52(2): 117-121. https://doi.org/10.1016/j.tafmec.2009.08.004
[25] Pugno, N., Cornetti, P., Carpinteri, A. (2007). New unified laws in fatigue: From the Wöhler’s to the Paris’ regime. Eng. Fract. Mech., 74(4): 595-601. https://doi.org/10.1016/j.engfracmech.2006.07.009